


News | JUNE 17, 2021
Market Update – June 17, 2021
This market update includes a natural gas storage update, electric and natural gas price movement, and a weather outlook. By utilizing this information, you can make better-informed energy decisions. This is general information to give you a quick summary of the market, please contact the energy solutions team at Mantis Innovation for additional information.
Natural Gas
The amount of natural gas available for usage is very important in the energy industry because among other things, it is used for heating, and as the main fuel source for generating electricity at power plants to be consumed by both homes and businesses. By comparing current levels of natural gas storage to the levels of last year and the past five years, an assessment as to the state of natural gas supplies to meet demand can be made. With other conditions remaining the same, the general concept is: if there is more than enough supply prices go down, and if there is not enough supply prices go up. In addition to the long-term outlooks, we compare what the market was expecting to be each week (injection or withdrawal number) verse what actually took place, this will either push prices up or down respectively.
Estimates for week ending 6/11/21 were for an injection in the 68 to 71 Bcf range.

Early market estimates for the storage report for week ending 6/18/21 are calling for an INJECTION in the 47 to 51 Bcf range.
Storage is now 453 Bcf lower than last year, and 126 Bcf lower than the 5-year average, which is well within the 5-year historical range.

Henry Hub
Henry Hub Wholesale Calendar Year 2022 future prices started below the 52-week average in June last year. From there prices declined thru the end of spring until the start of summer, when future prices hit the new 52-week low. After hitting the new low, future prices then rallied for the rest of the summer and into the fall, up to a high point by the end of October. Next, future 2022 prices dropped off considerably to range around the 52-week average for several months. However, since the start of April future prices have been rising and they have now rallied all the way up to just establish the new 52-week high, which prices are still close to now. Currently Henry Hub prices are down about 0.5% from June 14th’s 52-week high, which is above the average by about 12.6%.
The chart below shows the price movement of Calendar Year 2022 Henry Hub Wholesale Natural Gas over the past 52 weeks which is represented by the blue line. The price of Calendar Year 2022 Henry Hub Wholesale Natural Gas is shown on the left axis in relation to the date of the pricing on the bottom axis. Also, for comparison, there is a green line showing the highest price, an orange line showing the average price and a red line showing the lowest price over the past 52 weeks.

The chart below on the left is an enhanced look at the price movement shown above of Calendar Year 2022 Henry Hub Wholesale Natural Gas over just the past 5 weeks. The table below on the right are the numerical values that correspond to the chart below. The high, low, and average values are still based on the past 52 weeks.

Algonquin City Gate
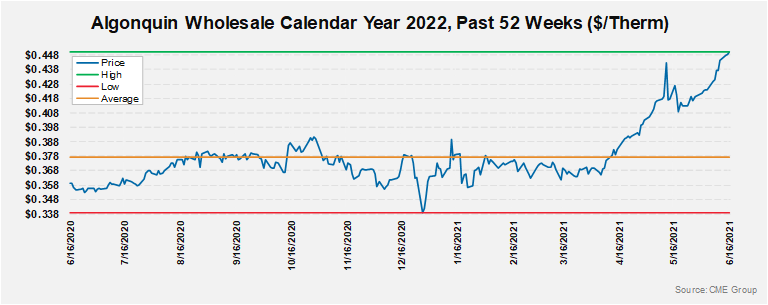
Algonquin Wholesale Calendar Year 2022 future prices started below the 52-week average in June last year. Since then, Algonquin 2022 future prices first came off a little before recovering thru the summer to range around the 52-week average. Future prices then rallied a bit into the fall, pushing further above the average, up to a high point at the end of October. After hitting a high point in October, prices dropped off quickly to range mostly below the 52-week average , until prices fell even further in a short-lived price crash at the end of last year that established the new 52-week low. Next, 2022 future prices recovered quickly, and they were back to ranging closer to the 52-week average for several months. However, since the start of April future prices have been rising and they have recently rallied all the way up to just establish the new 52-week high. Currently Algonquin prices are at the 52-week high, which is above the average by around 19.3%.
The chart below shows the price movement of Calendar Year 2022 Algonquin Wholesale Natural Gas over the past 52 weeks which is represented by the blue line. The price of Calendar Year 2022 Algonquin Wholesale Natural Gas is shown on the left axis in relation to the date of the pricing on the bottom axis. Also, for comparison, there is a green line showing the highest price, an orange line showing the average price and a red line showing the lowest price over the past 52 weeks.
The chart below on the left is an enhanced look at the price movement shown above of Calendar Year 2022 Algonquin Wholesale Natural Gas over just the past 5 weeks. The table below on the right are the numerical values that correspond to the chart below. The high, low, and average values are still based on the past 52 weeks.

ISO-NE
ISO-NE Wholesale Internal Hub Around-the-Clock Calendar Year 2022 future prices started near the 52-week low in June last year. From there 2022 future prices slowly recovered thru the start of summer before starting to rally at the end of the summer which continued into the fall, hitting a high point by the end of October. Future prices then dropped off at the start of November and kept falling to establish the new 52-week low in December. However, since the start of the new year prices have been steadily increasing, and they have recently rallied all the way up to just establish the new 52-week high. Currently ISO-NE prices are at the 52-week high, which is above the average by around 19.7%.
The chart below shows the price movement of Calendar Year 2022 ISO-NE Internal Hub Wholesale Around-the-Clock Electricity over the past 52 weeks which is represented by the blue line. The price of Calendar Year 2022 ISO-NE Internal Hub Wholesale Around-the-Clock Electricity is shown on the left axis in relation to the date of the pricing on the bottom axis. Also, for comparison, there is a green line showing the highest price, an orange line showing the average price and a red line showing the lowest price over the past 52 weeks.

The chart below on the left is an enhanced look at the price movement shown above of Calendar Year 2022 ISO-NE Internal Hub Wholesale Around-the-Clock Electricity over just the past 5 weeks. The table below on the right are the numerical values that correspond to the chart below. The high, low, and average values are still based on the past 52 weeks.

TETCO-M3
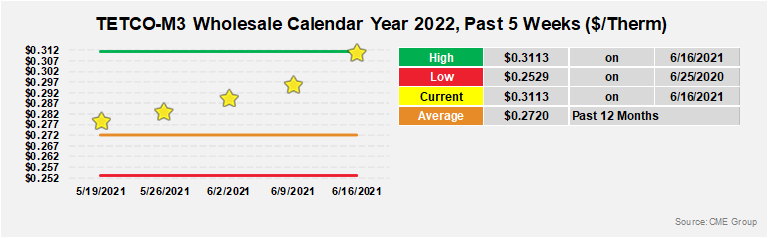
TETCO-M3 Wholesale Calendar Year 2022 future prices started below the 52-week average in June last year. From there future prices continued to decline until the start of summer, when the new 52-week low was established. Next, TETCO-M3 2022 future prices rallied off the lows, pushed above the average, and spiked up to a high point by the end of October. Since then, future prices dropped off to range mostly around the 52-week average for several months. However, since the start of April future prices have been recovering, and they have just rallied all the way up to establish the new 52-week high. Currently TETCO-M3 prices are at the 52-week high, which is above the average by around 14.5%.
The chart below shows the price movement of Calendar Year 2022 TETCO-M3 Wholesale Natural Gas over the past 52 weeks which is represented by the blue line. The price of Calendar Year 2022 TETCO-M3 Wholesale Natural Gas is shown on the left axis in relation to the date of the pricing on the bottom axis. Also, for comparison, there is a green line showing the highest price, an orange line showing the average price and a red line showing the lowest price over the past 52 weeks.

The chart below on the left is an enhanced look at the price movement shown above of Calendar Year 2022 TETCO-M3 Wholesale Natural Gas over just the past 5 weeks. The table below on the right are the numerical values that correspond to the chart below. The high, low, and average values are still based on the past 52 weeks.
PJM Western Hub
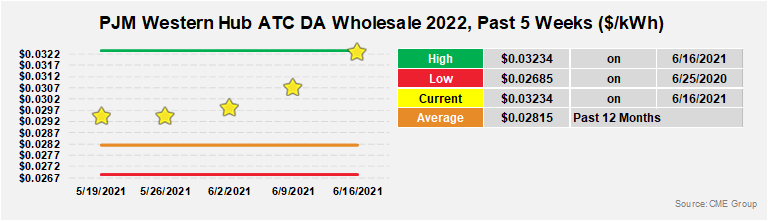
PJM Wholesale Western Hub Around-the-Clock Calendar Year 2022 future prices started near the 52-week low in June last year, that was then established just over a week later. After hitting the new low, prices rallied thru the summer and into the fall, hitting a high point near the end of November. Since then, prices dropped off to range mostly around the 52-week average for several months. However, since the start of April future prices have been climbing, and they have just rallied all the way up to just establish the new 52-week high. Currently PJM prices are at the 52-week high, which is above the average by about 14.9%.
The chart below shows the price movement of Calendar Year 2022 PJM Western Hub Wholesale Around-the-Clock Electricity over the past 52 weeks which is represented by the blue line. The price of Calendar Year 2022 PJM Western Hub Wholesale Around-the-Clock Electricity is shown on the left axis in relation to the date of the pricing on the bottom axis. Also, for comparison, there is a green line showing the highest price, an orange line showing the average price and a red line showing the lowest price over the past 52 weeks.

The chart below on the left is an enhanced look at the price movement shown above of Calendar Year 2022 PJM Western Hub Wholesale Around-the-Clock Electricity over just the past 5 weeks. The table below on the right are the numerical values that correspond to the chart below. The high, low, and average values are still based on the past 52 weeks.
Houston Ship Channel
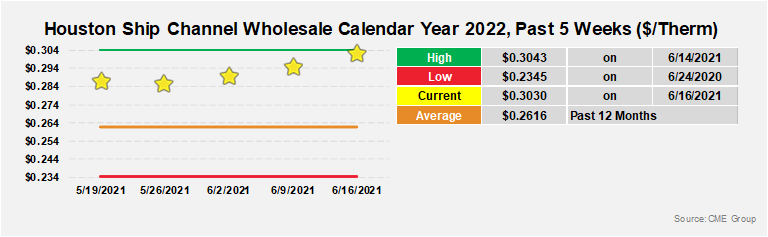
Houston Ship Channel Wholesale Calendar Year 2022 future prices started below the 52-average in June last year. From there future prices continued to decline until the start of summer, when the new 52-week low was established. Then for the rest of summer and into the fall prices recovered and rallied up to hit a high point by the end of October. Next, HSC 2022 future prices dropped off considerably, to range further below the 52-week average by the end of last year. Future prices then started off the new year with a rally, before dropping off to range a little lower for a few months. However, since the end of March future prices have been climbing, and they have just rallied all the way up to establish the new 52-week high, which prices are still close to now. Currently HSC prices are down about 0.4% from June 14th’s 52-week high, which is above the average by around 15.8%.
The chart below shows the price movement of Houston Ship Channel Wholesale Calendar Year 2022 over the past 52 weeks which is represented by the blue line. The price of Houston Ship Channel Wholesale Calendar Year 2022 is shown on the left axis in relation to date of the pricing on the bottom axis. Also, for comparison there is a green line showing the highest price, an orange line showing the average price, and a red line showing the lowest price over the past 52 weeks.

The chart below on the left is an enhanced look at the price movement shown above of Houston Ship Channel Wholesale Calendar Year 2022 over just the past 5 weeks. The table below on the right are the numerical values that correspond to the chart below. The high, low, and average values are still based on the past 52 weeks.
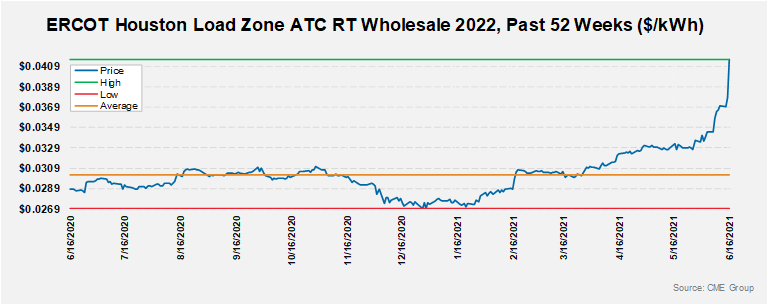
ERCOT Houston
ERCOT Houston Load Zone Around-the-Clock Calendar Year 2022 future prices started closer to the 52-week average in June last year. From there future prices continued to range around the 52-week average until last November. Next, future prices crashed down to establish the new 52-week low to close out last year. However, since the start of this year future prices have been climbing, and they have just rallied all the way up to just establish the new 52-week high. Currently Houston prices are at the 52-week high, which is above the average by about 37.6%.
The chart below shows the price movement of ERCOT Houston Load Zone Around-the-Clock Calendar Year 2022 over the past 52 weeks which is represented by the blue line. The price of ERCOT Houston Load Zone Around-the-Clock Calendar Year 2022 is shown on the left axis in relation to date of the pricing on the bottom axis. Also, for comparison there is a green line showing the highest price, an orange line showing the average price, and a red line showing the lowest price over the past 52 weeks.
The chart below on the left is an enhanced look at the price movement shown above of ERCOT Houston Load Zone Around-the-Clock Calendar Year 2022 over just the past 5 weeks. The table below on the right are the numerical values that correspond to the chart below. The high, low, and average values are still based on the past 52 weeks.

General Disclaimer: This information is provided as a courtesy to our clients and/or potential clients and should not be construed as an offer to sell or as a solicitation of an offer to buy securities based on, or contracts in or for, any energy commodity. Mantis Innovation does not sell electricity and/or natural gas, and as such, the actual terms and conditions of competitive supply are solely provided for by the competitive supplier’s contract with the client. Reliance on this information for decisions is done so at the sole risk of the reader and past performance is not indicative of future results. This information is provided as a general description of various electricity and/or natural gas purchasing strategies that may be decided upon by our clients. Both clients and potential clients should consider their individual circumstances and other sources of available information before arriving at a decision. Graphs and charts are for illustrative purposes only.
 Market Update – September 25, 2023 - This market update includes a natural gas storage update, electric and natural gas price movement, and a weather outlook. By… Read more
- Market Update – June 12, 2023 - This market update includes a natural gas storage update, electric and natural gas price movement, and a weather outlook. By… Read more
- Market Update – April 24, 2023 - This market update includes a natural gas storage update, electric and natural gas price movement, and a weather outlook. By… Read more