This market update includes a natural gas storage update, electric and natural gas price movement, and a weather outlook. By utilizing this information, you can make better-informed energy decisions. This is general information to give you a quick summary of the market, please contact the energy solutions team at Mantis Innovation for additional information. Additionally, you can get these updates sent to your inbox weekly by signing up here.
Natural Gas
The amount of natural gas available for usage is very important in the energy industry because, among other things, it is used for heating, and as a main fuel source for generating electricity at power plants to be consumed by both homes and businesses. By comparing current levels of natural gas storage to the levels of last year and the past five years, an assessment as to the state of natural gas supplies to meet demand can be made.
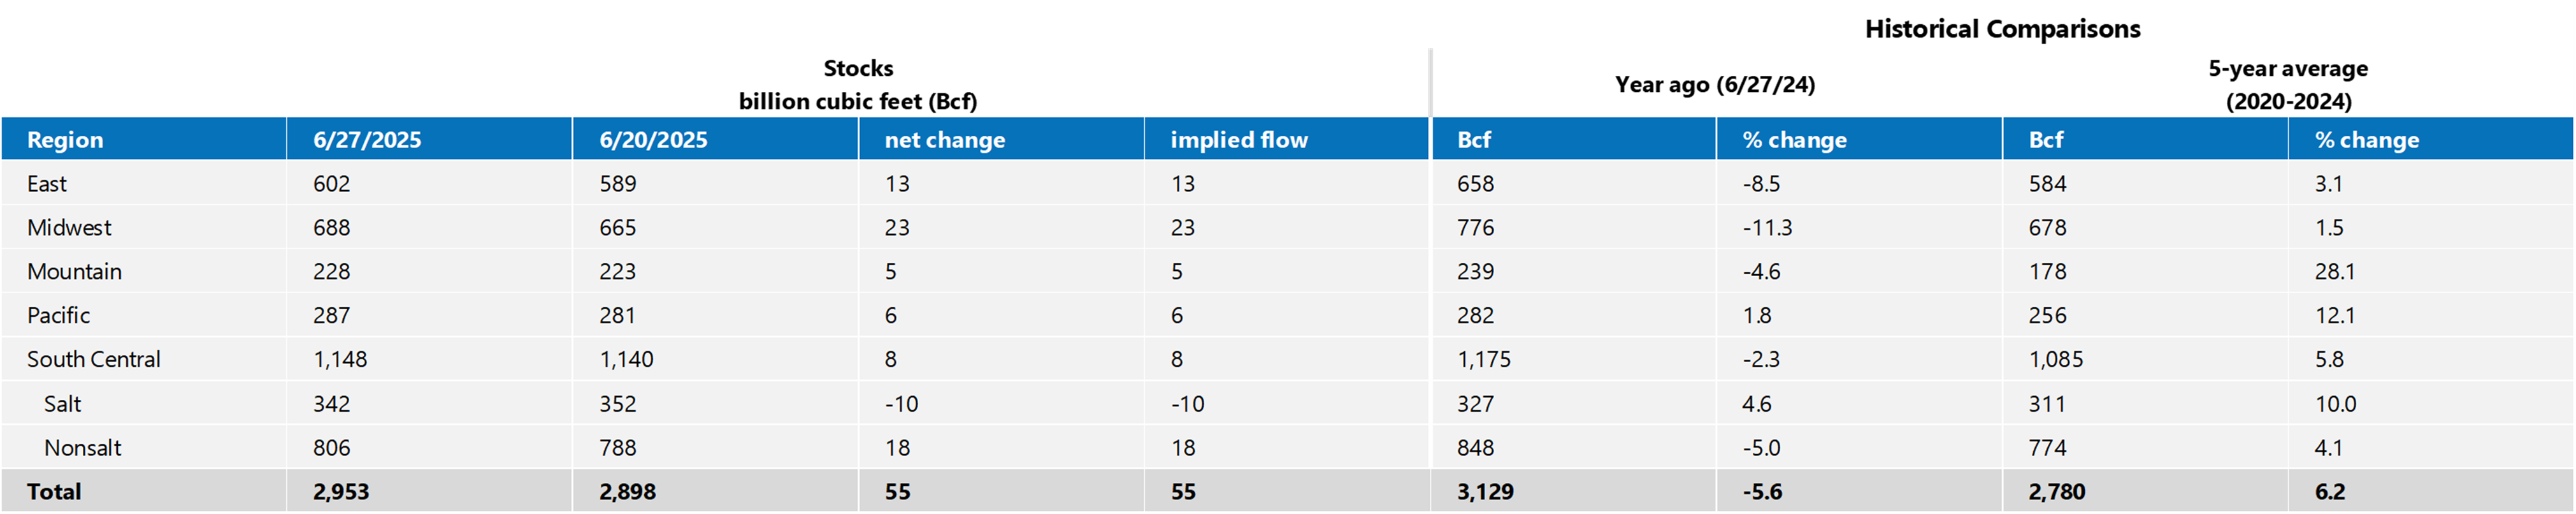
Final estimates for week ending 6/27/25 were for an injection in the 49 to 51 Bcf range.
The total net injection came in above the final estimates, with 55 Bcf being put into storage. However, this a relatively low storage number compared to recent weeks.
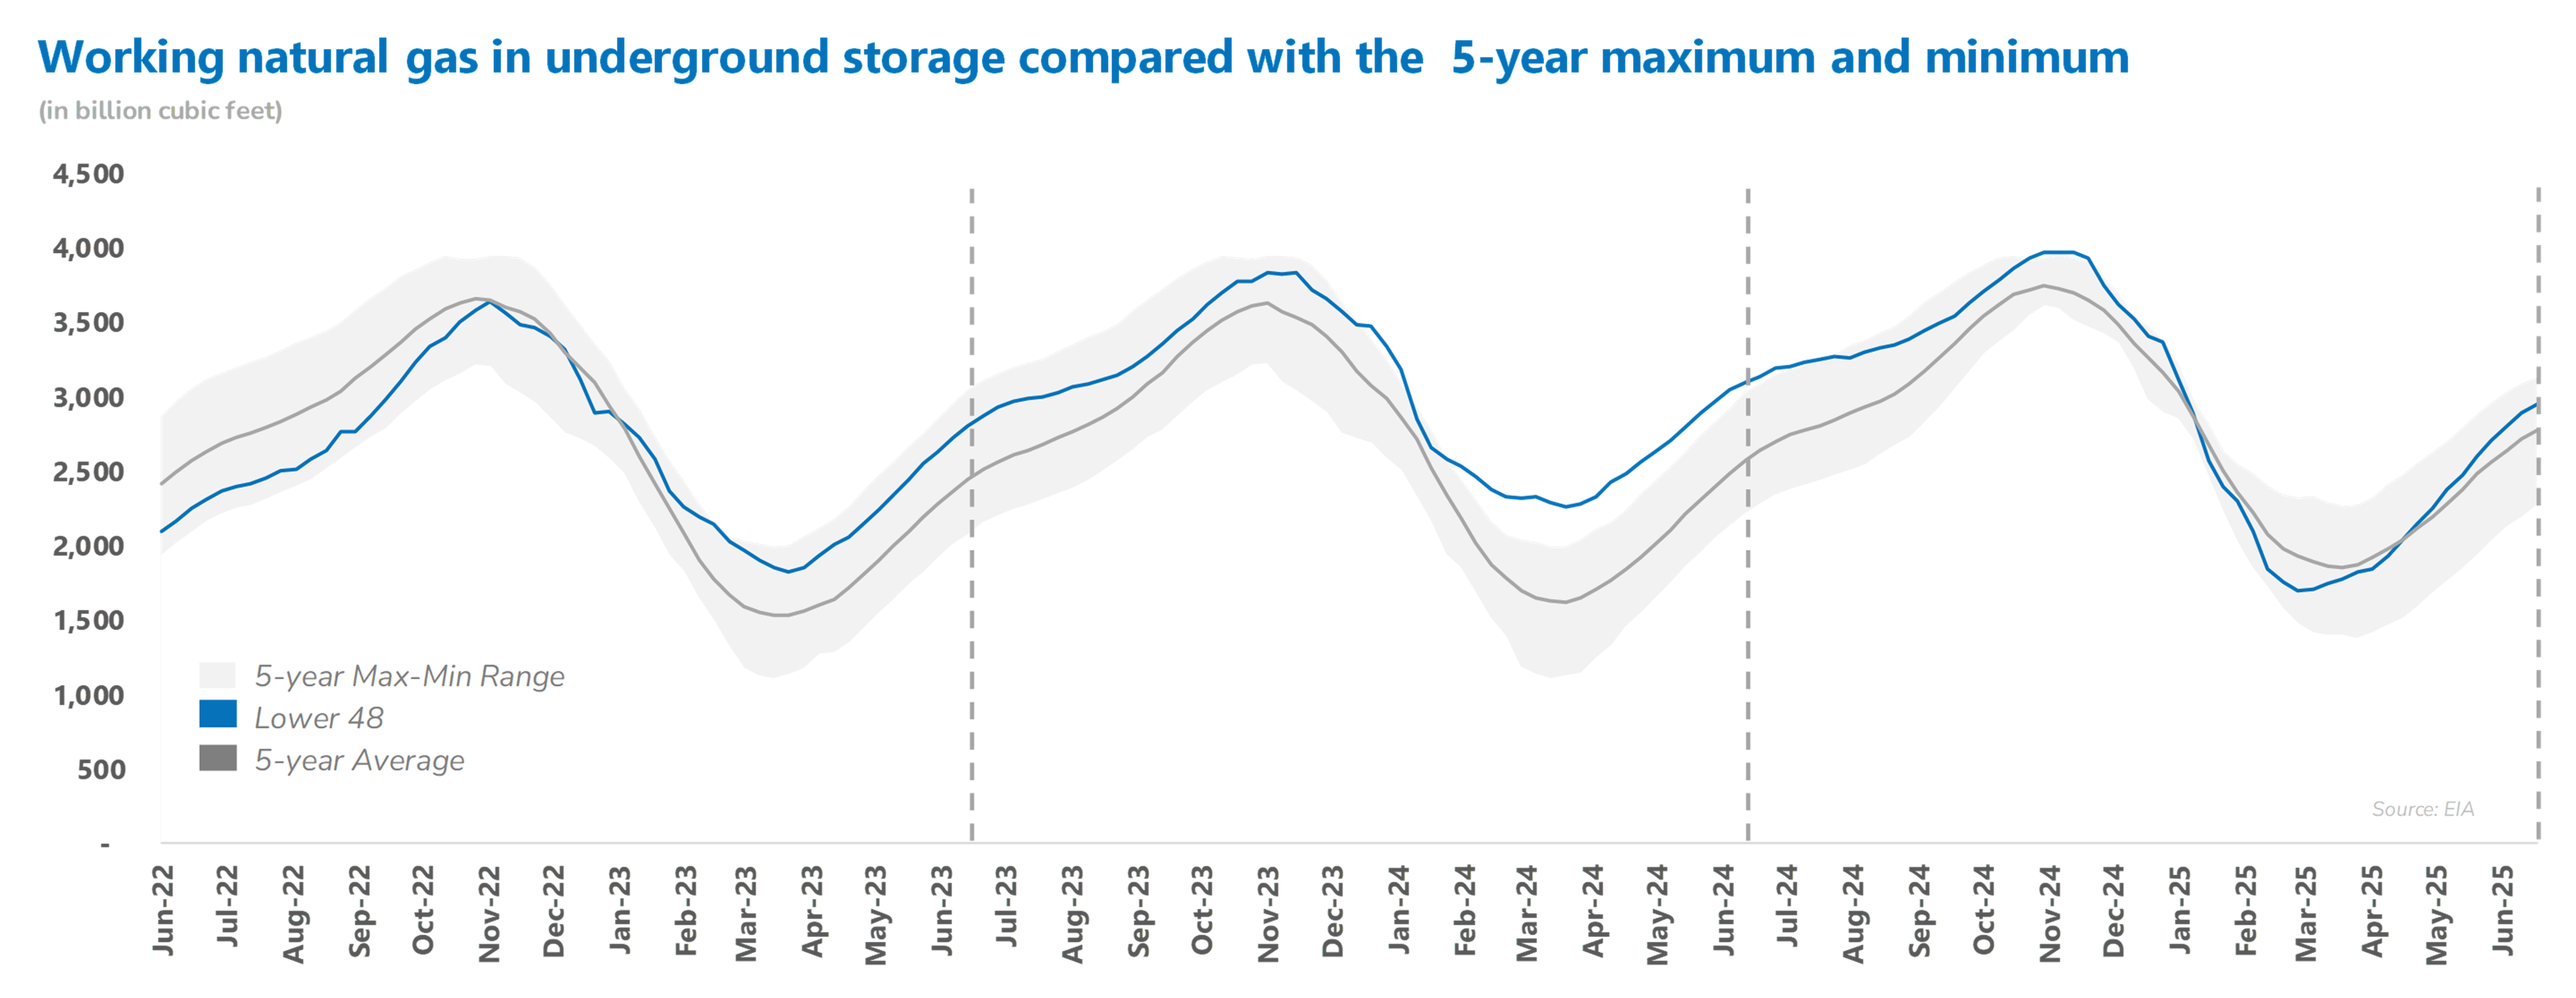
Storage is now 176 Bcf below last year, and 173 Bcf above the 5-year average, which is within the 5-year historical range.
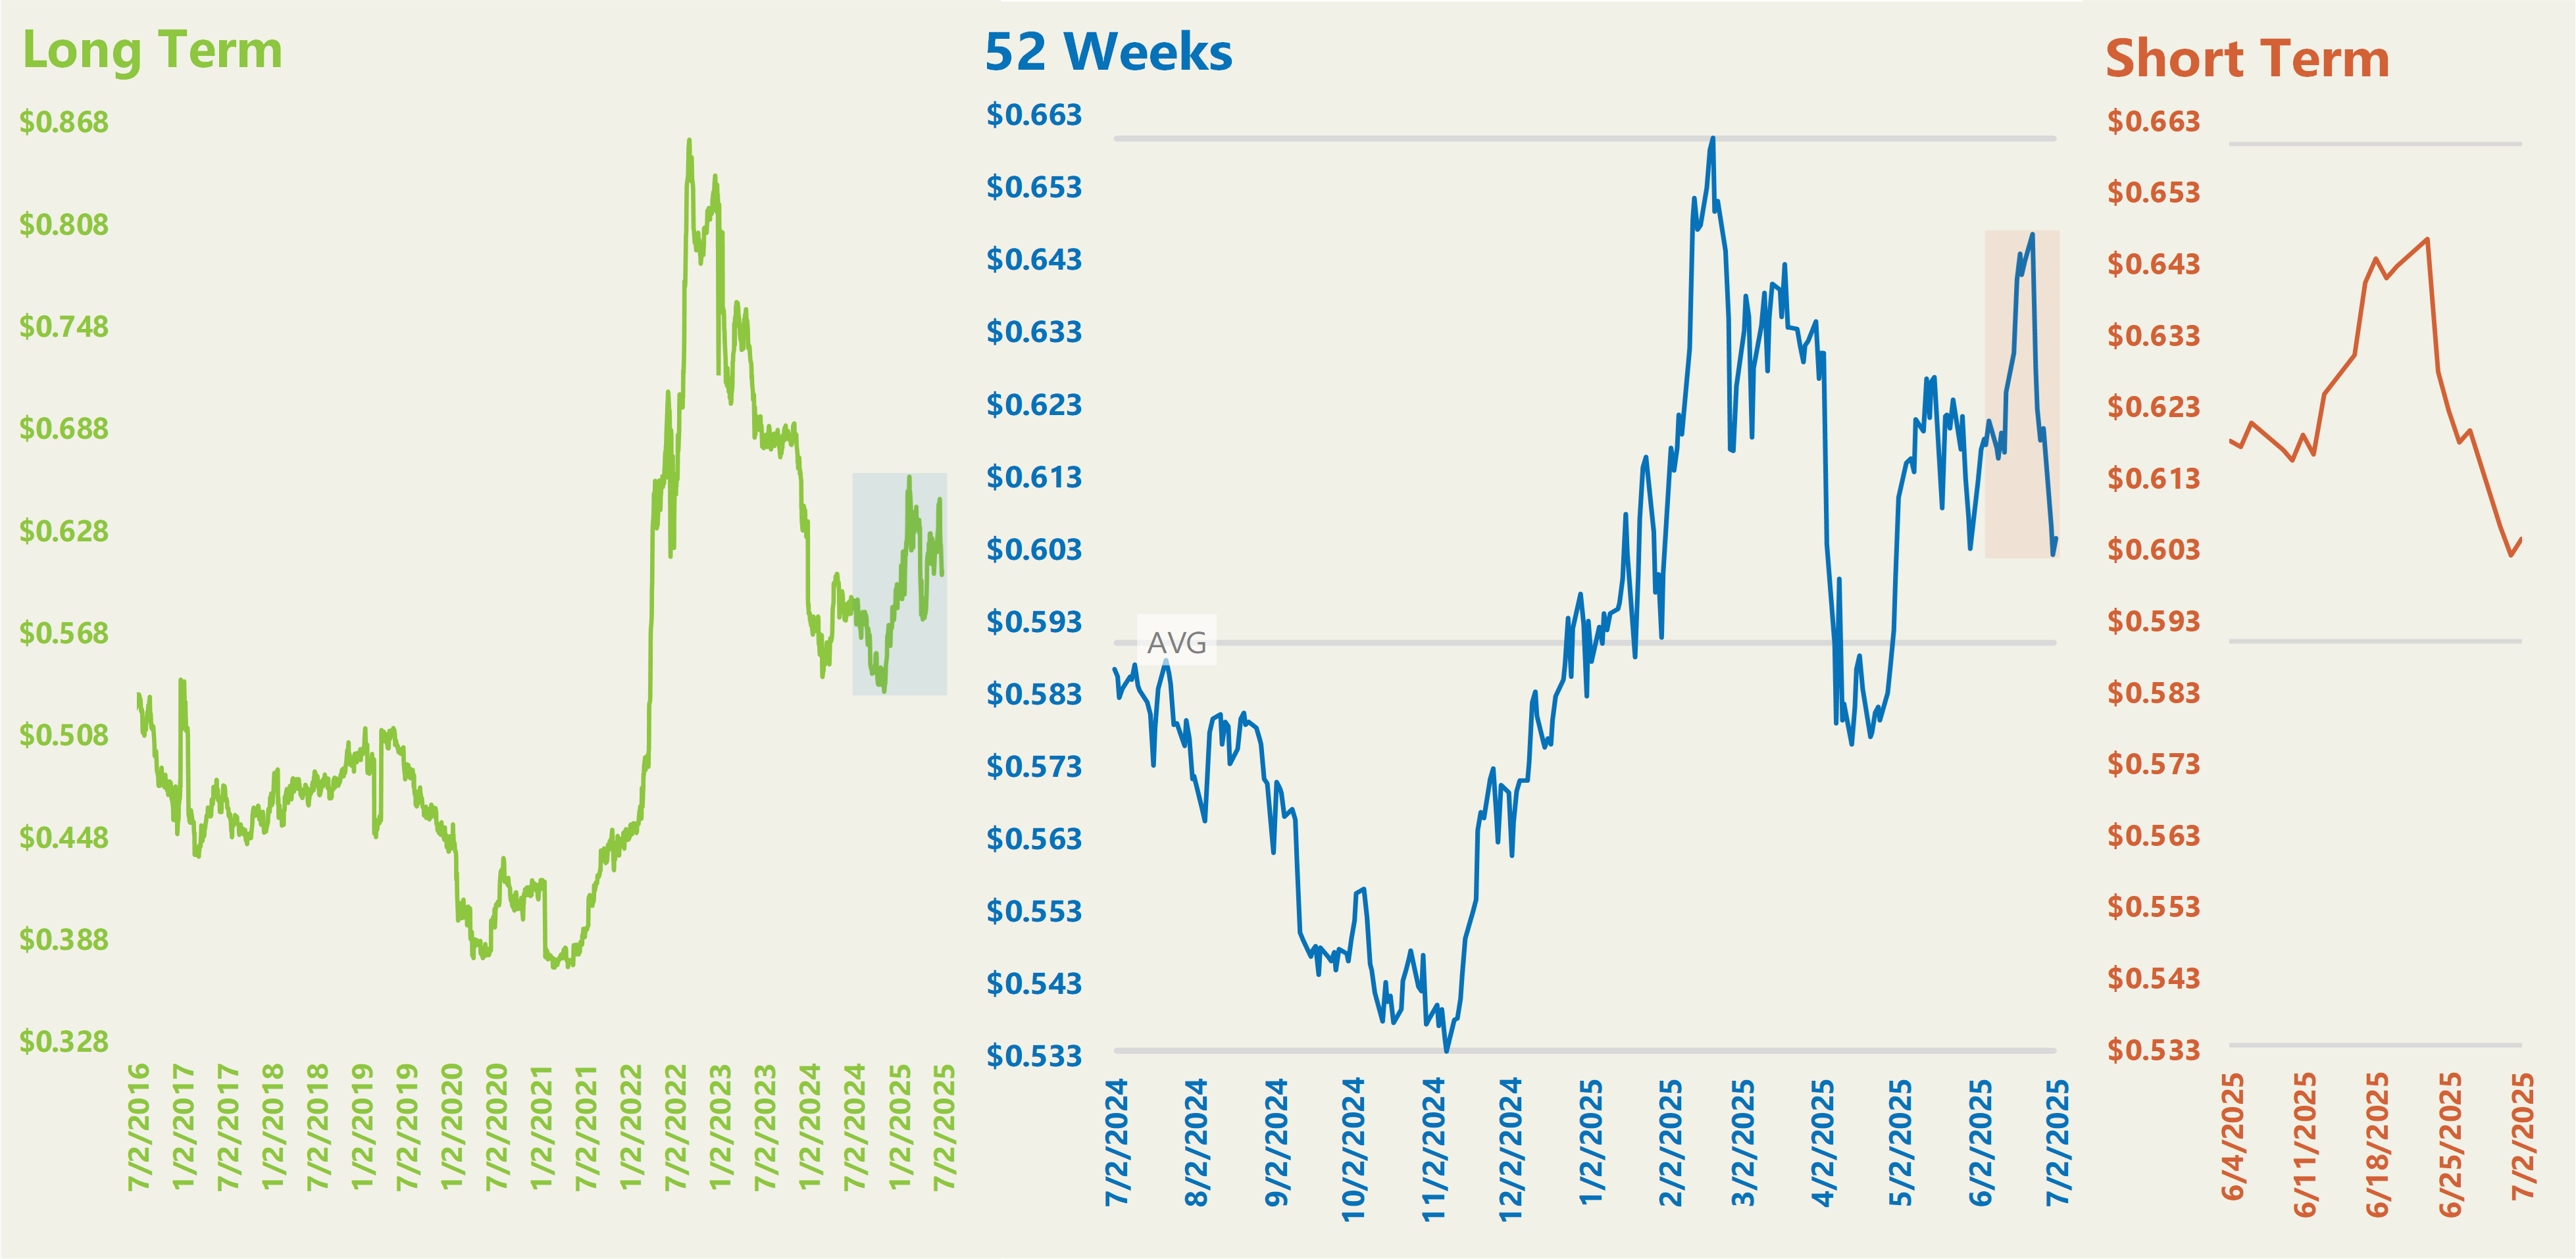
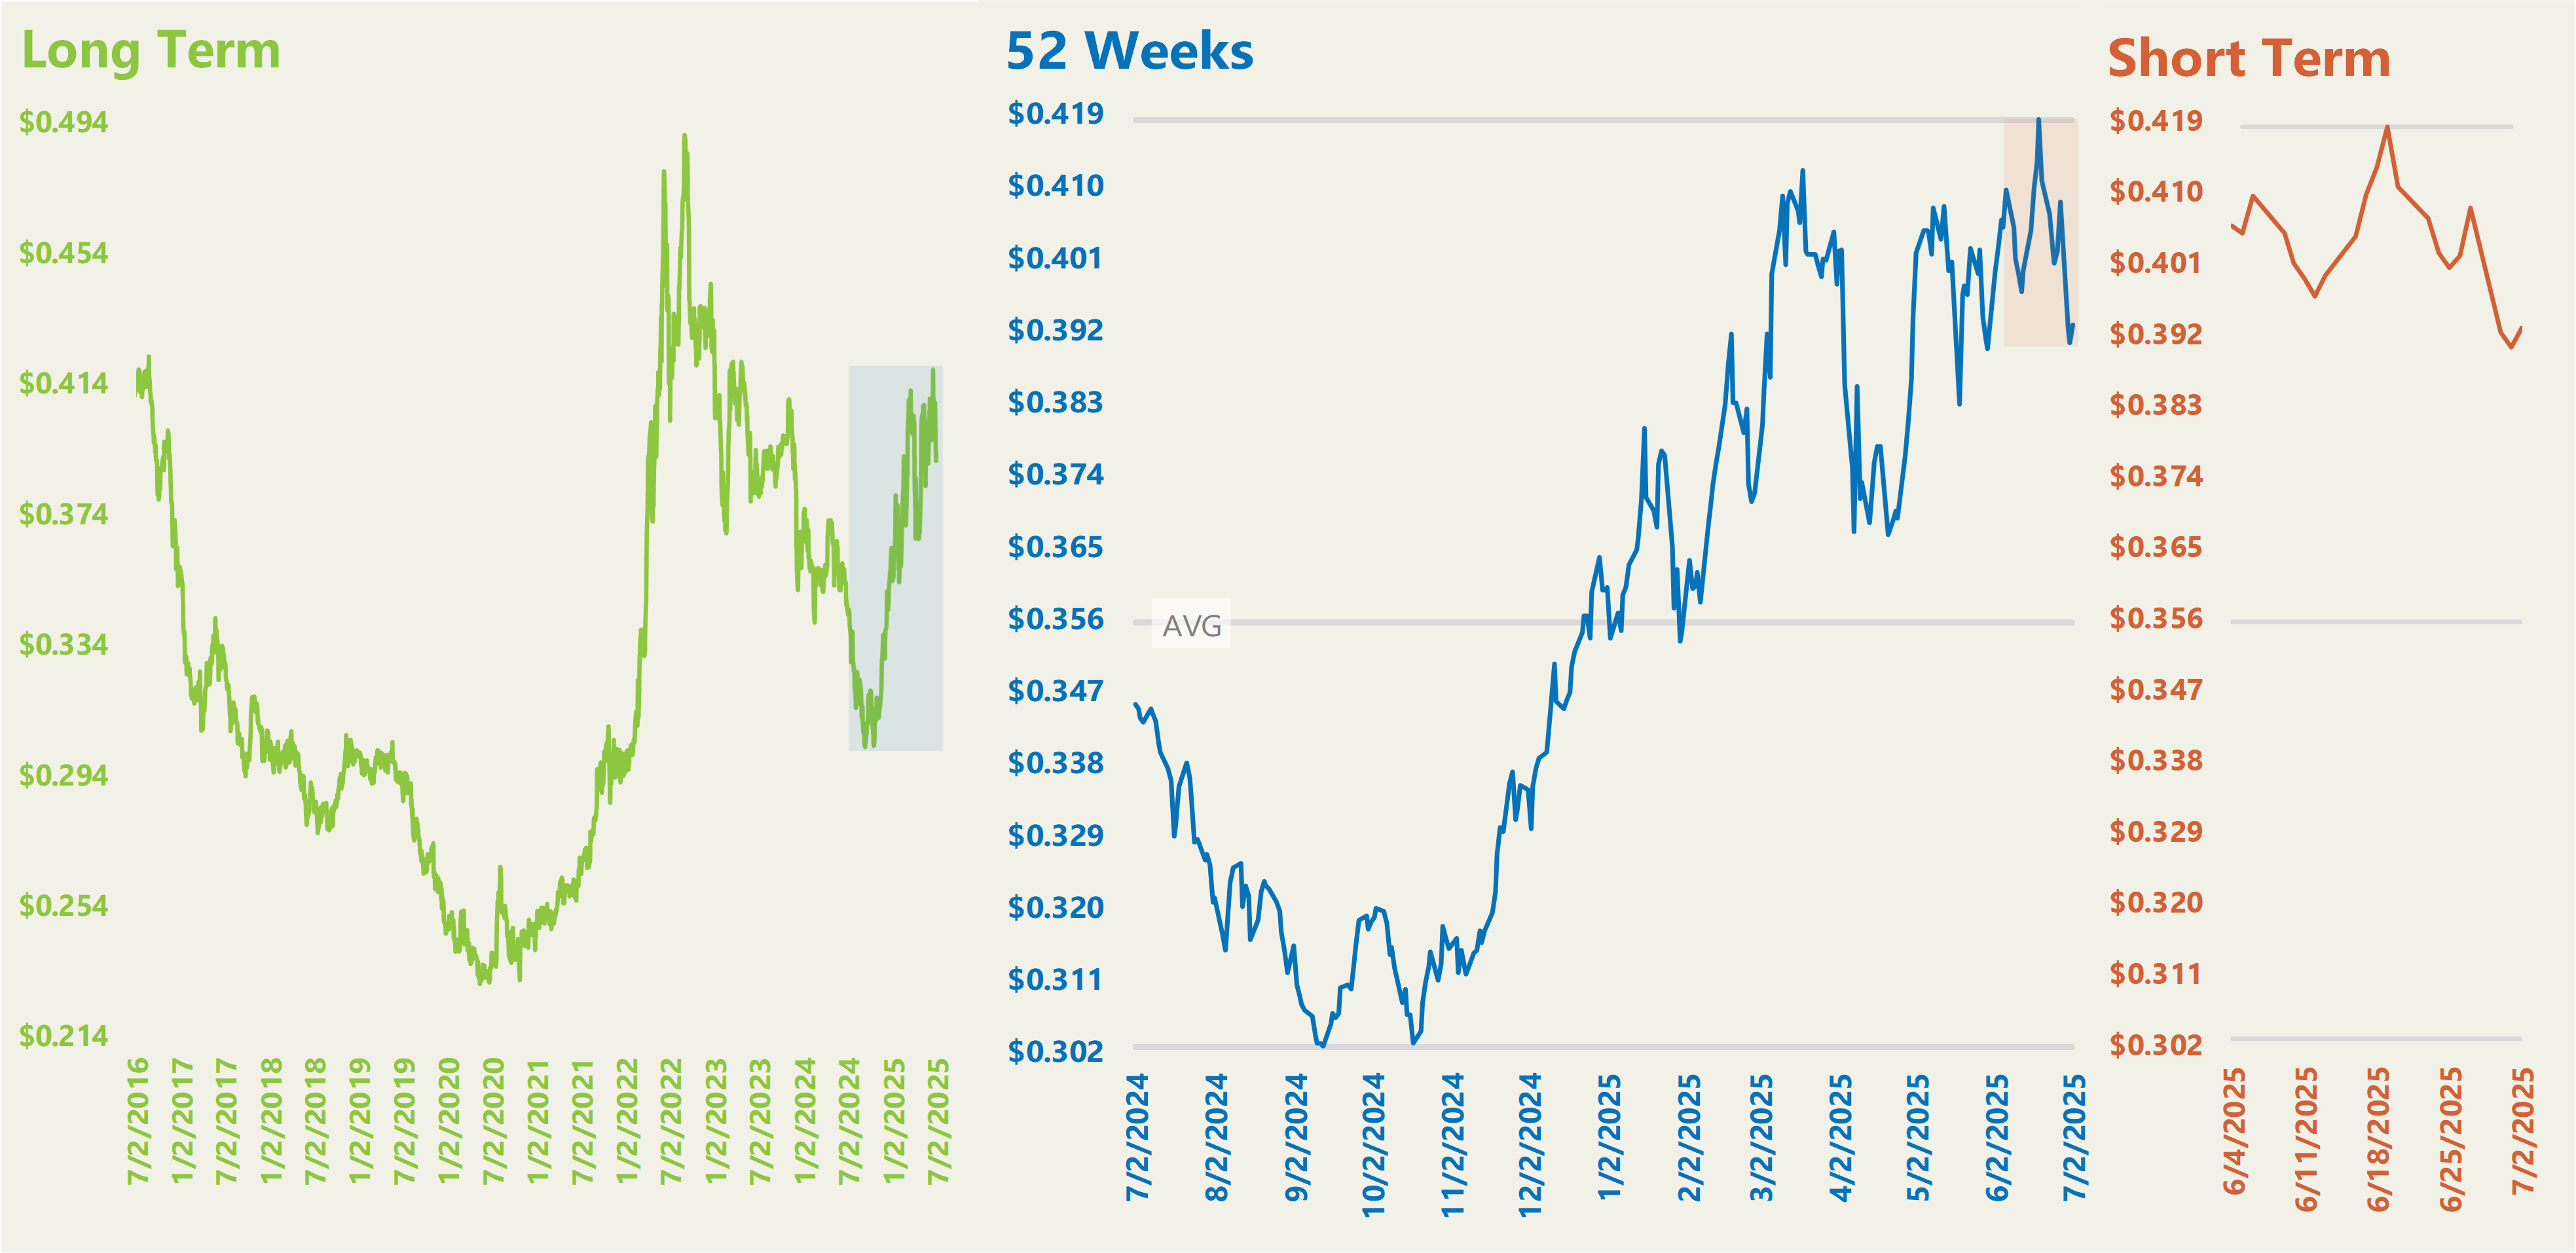
Henry Hub
Henry Hub prices are currently down about 6% from the 52-week high on June 19, which is approximately 8% above the average.
Henry Hub Wholesale Calendar Year 2026 Week to Week Fluctuation ($/Therm)
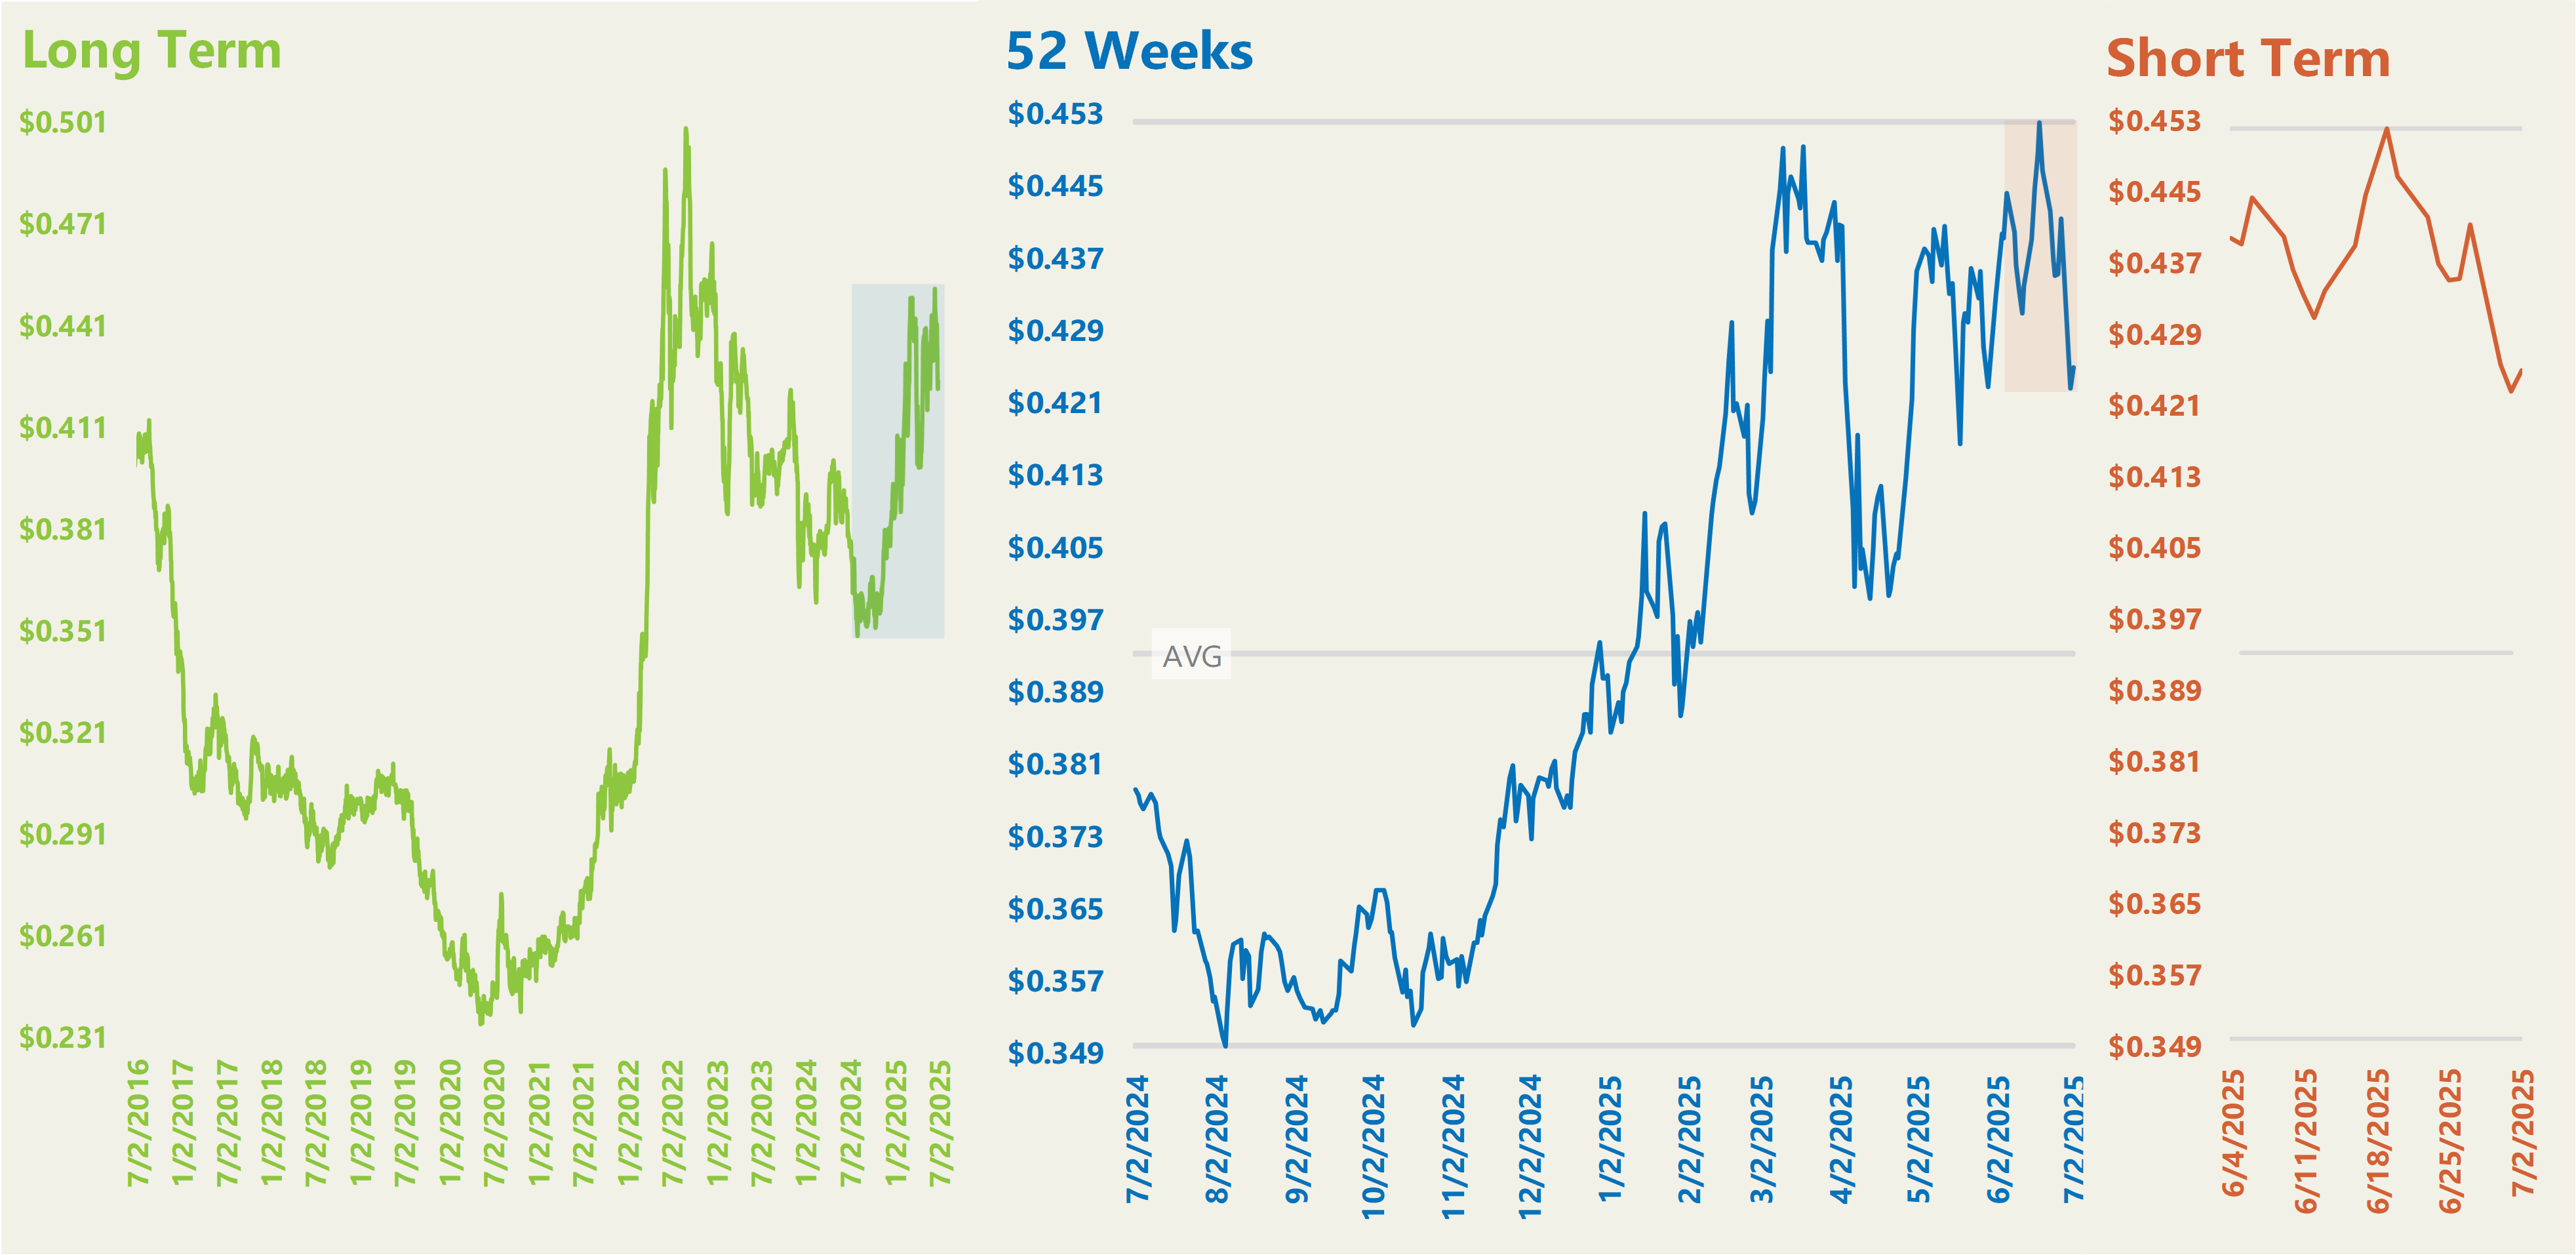
The graphs above show the price movement of the Calendar Year 2026 Henry Hub Wholesale Natural Gas over various periods of time. The price of the calendar year is shown on the left y-axis in relation to the date of the pricing on the bottom x-axis. On the 52-week and short-term graphs, you can see the minimum, maximum, and average price of the past 52 weeks indicated by the gray lines.
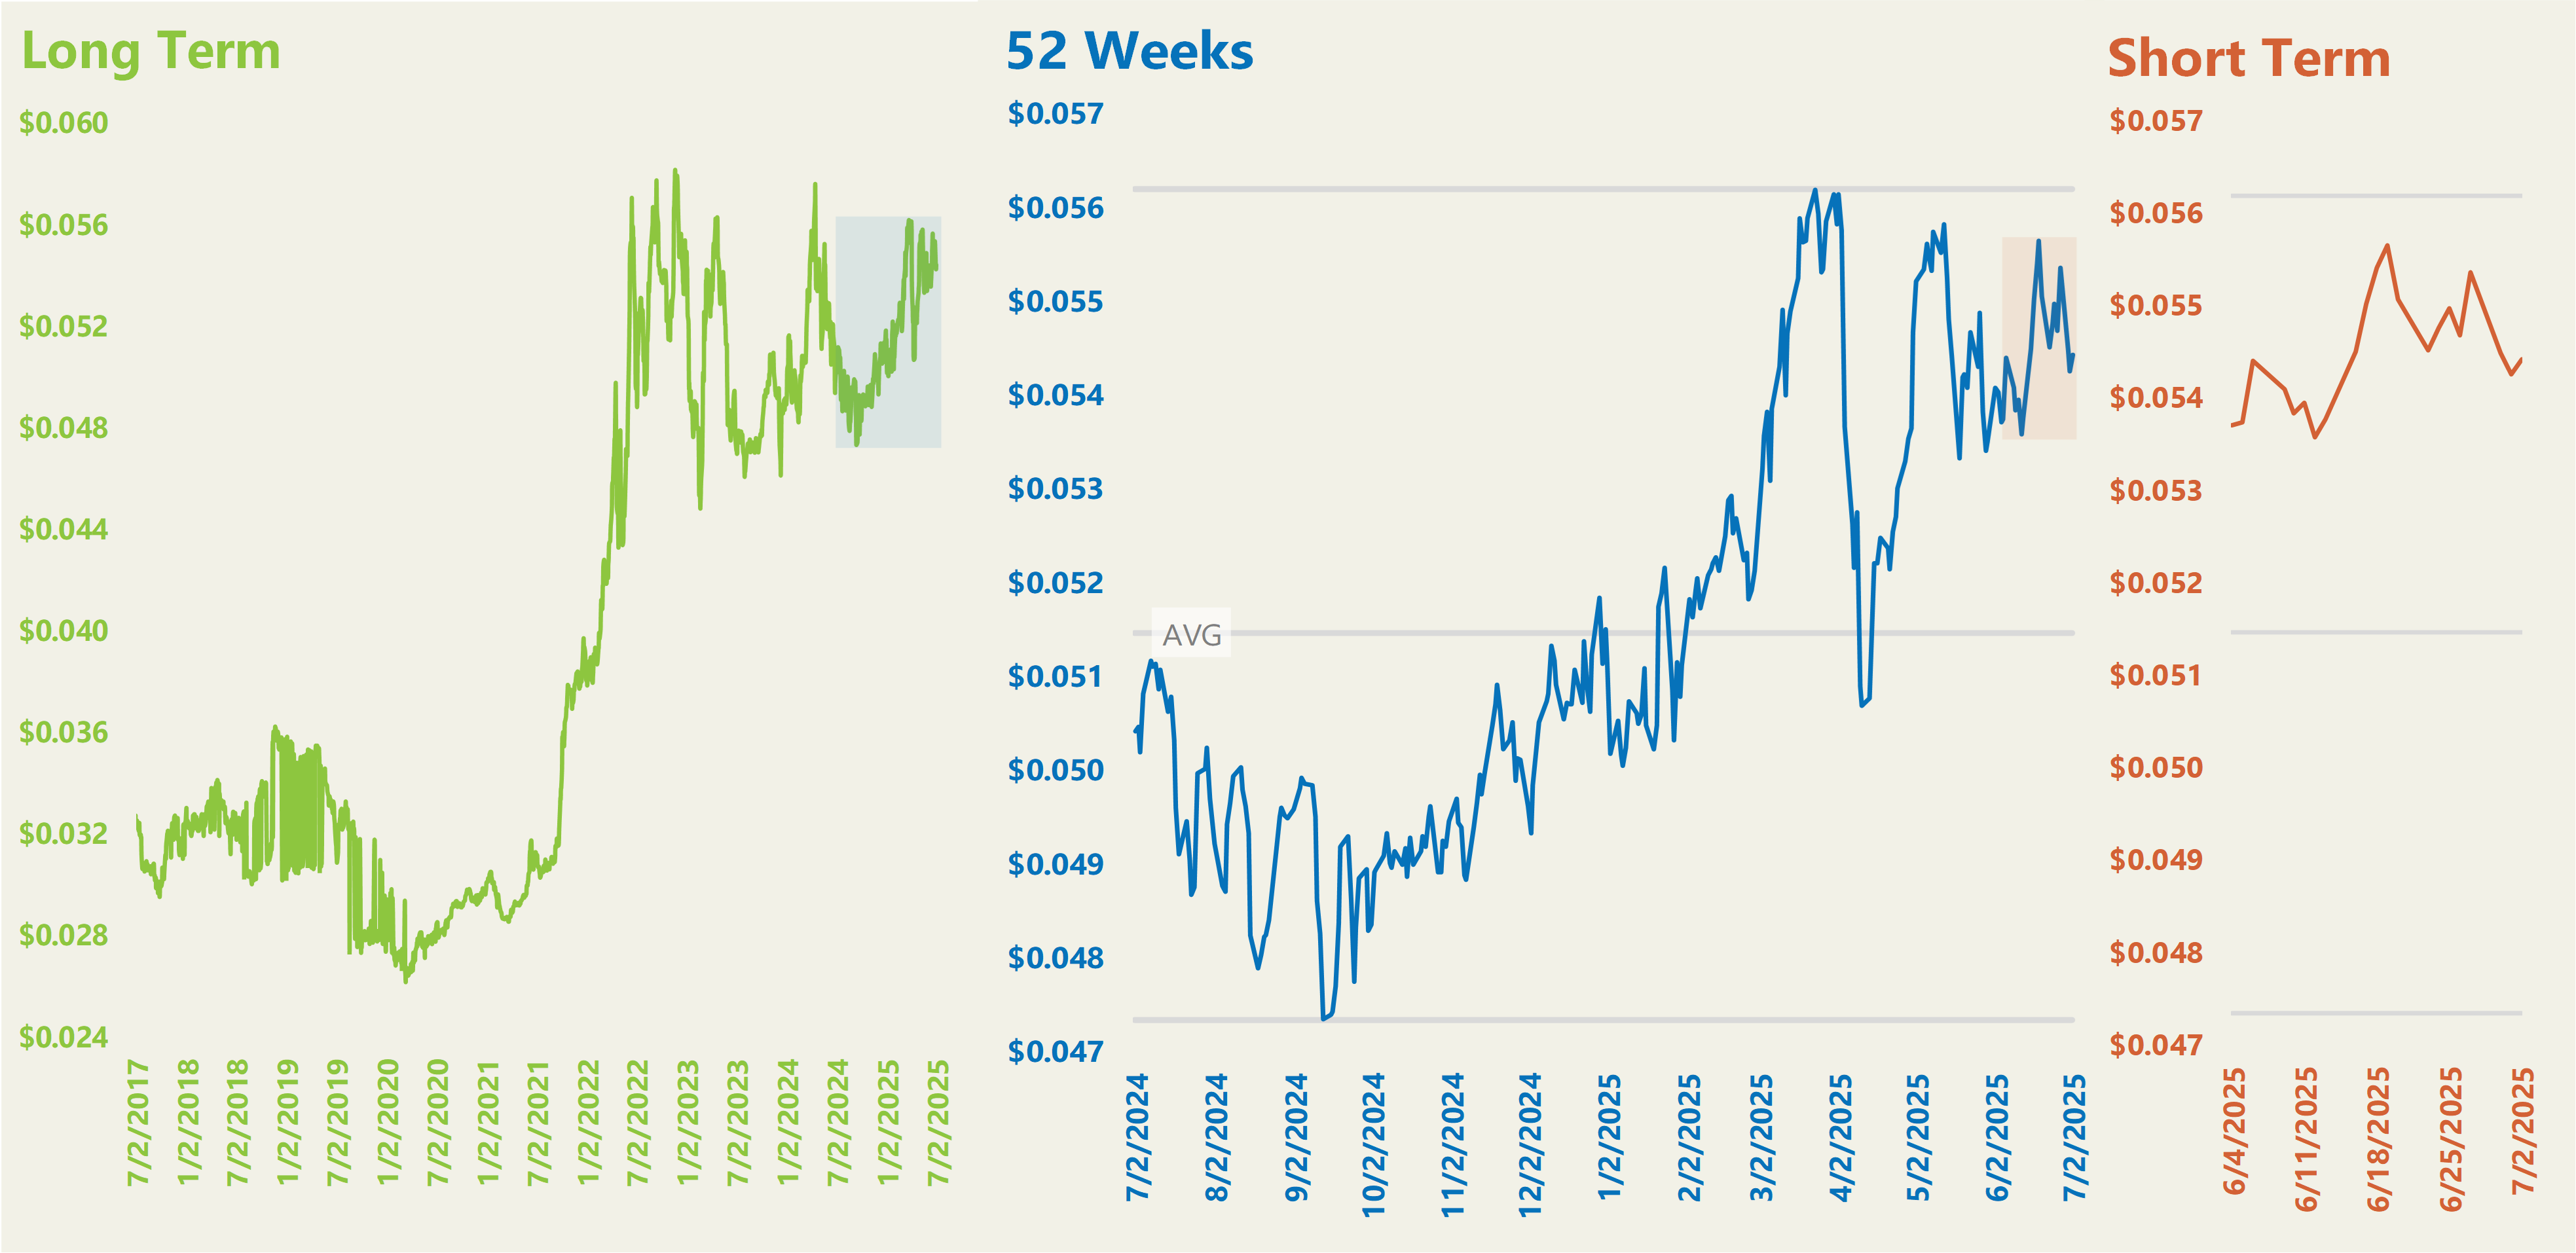
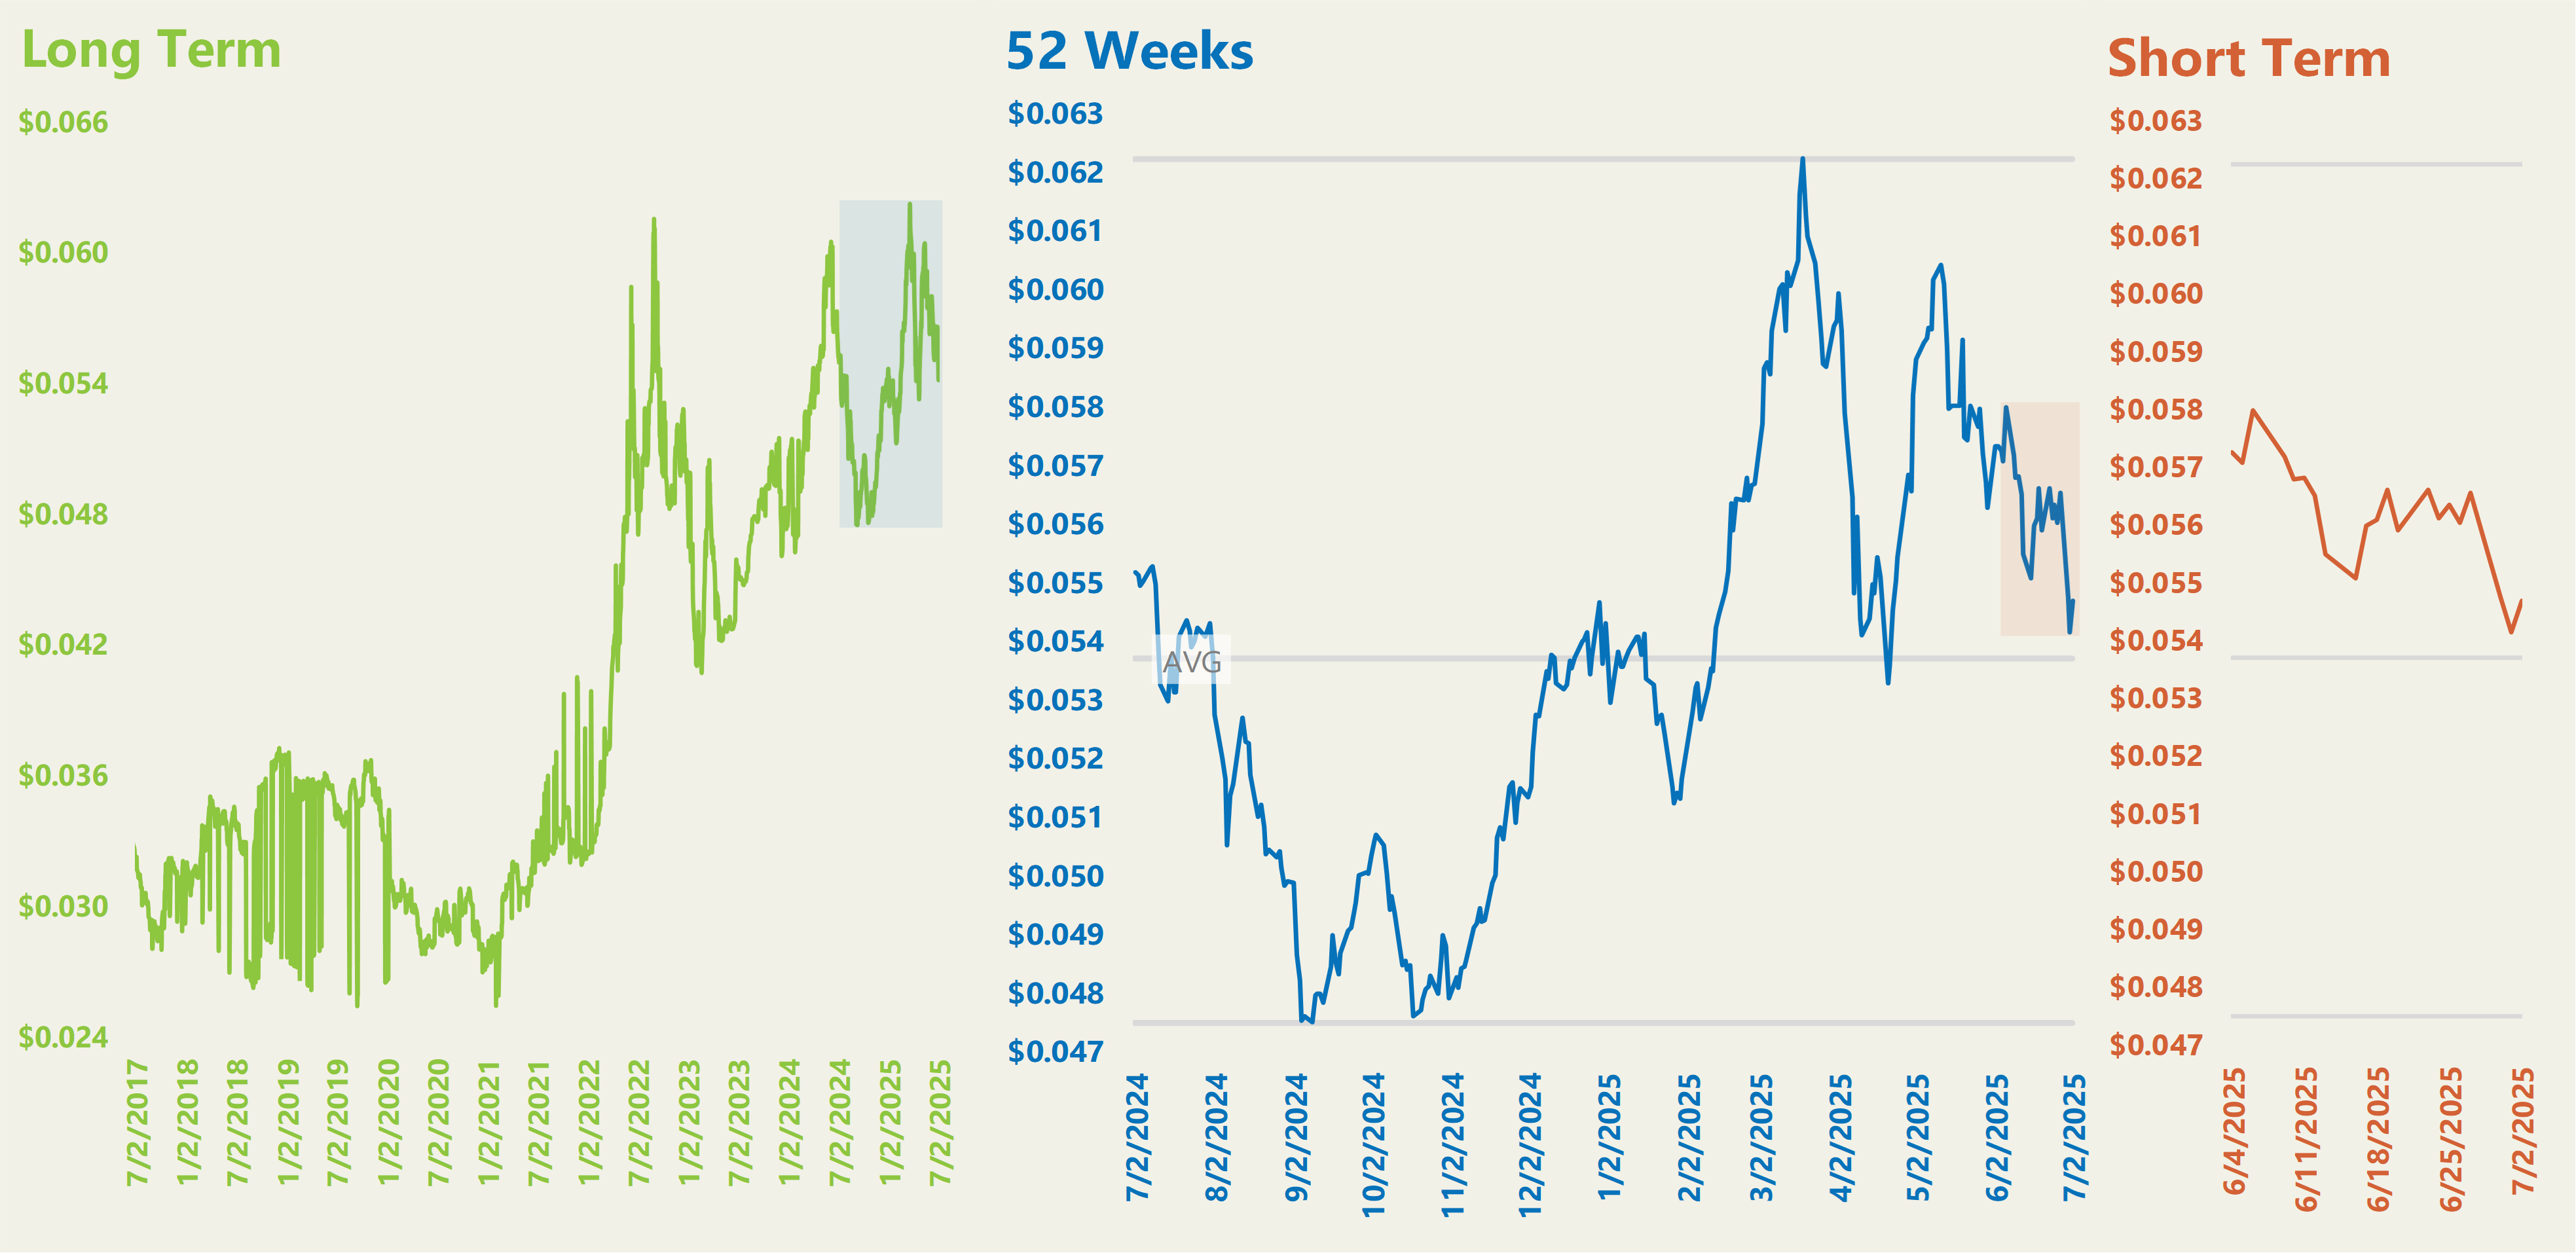
Algonquin City Gate
Algonquin prices are currently down about 8.4% from the 52-week high on February 19, which is around 2.4% above the average.
Algonquin Wholesale Calendar Year 2026 Week to Week Fluctuation ($/Therm)
The graphs above show the price movement of Calendar Year 2026 Algonquin Wholesale Naural Gas over various periods of time. The price of the calendar year is shown on the left y-axis in relation to the date of the pricing on the bottom x-axis. On the 52-week and short-term graphs, you can see the minimum, maximum, and average prices of the past 52 weeks indicated by the gray lines.
ISO-NE
ISO-NE prices are currently down about 4% from the 52-week high on February 21, which is approximately 4.2% above the average.
ISO-NE Internal Hub ATC DA Wholesale Calendar Year 2026 Week to Week Fluctuation ($/kWh)
The graphs above show the price movement of Calendar Year 2026 ISO-NE Internal Hub ATC DA Wholesale Electricity over various periods of time. The price of the calendar year is shown on the left y-axis in relation to the date of the pricing on the bottom x-axis. On the 52-week and short-term graphs, you can see the minimum, maximum, and average prices of the past 52 weeks indicated by the gray lines.
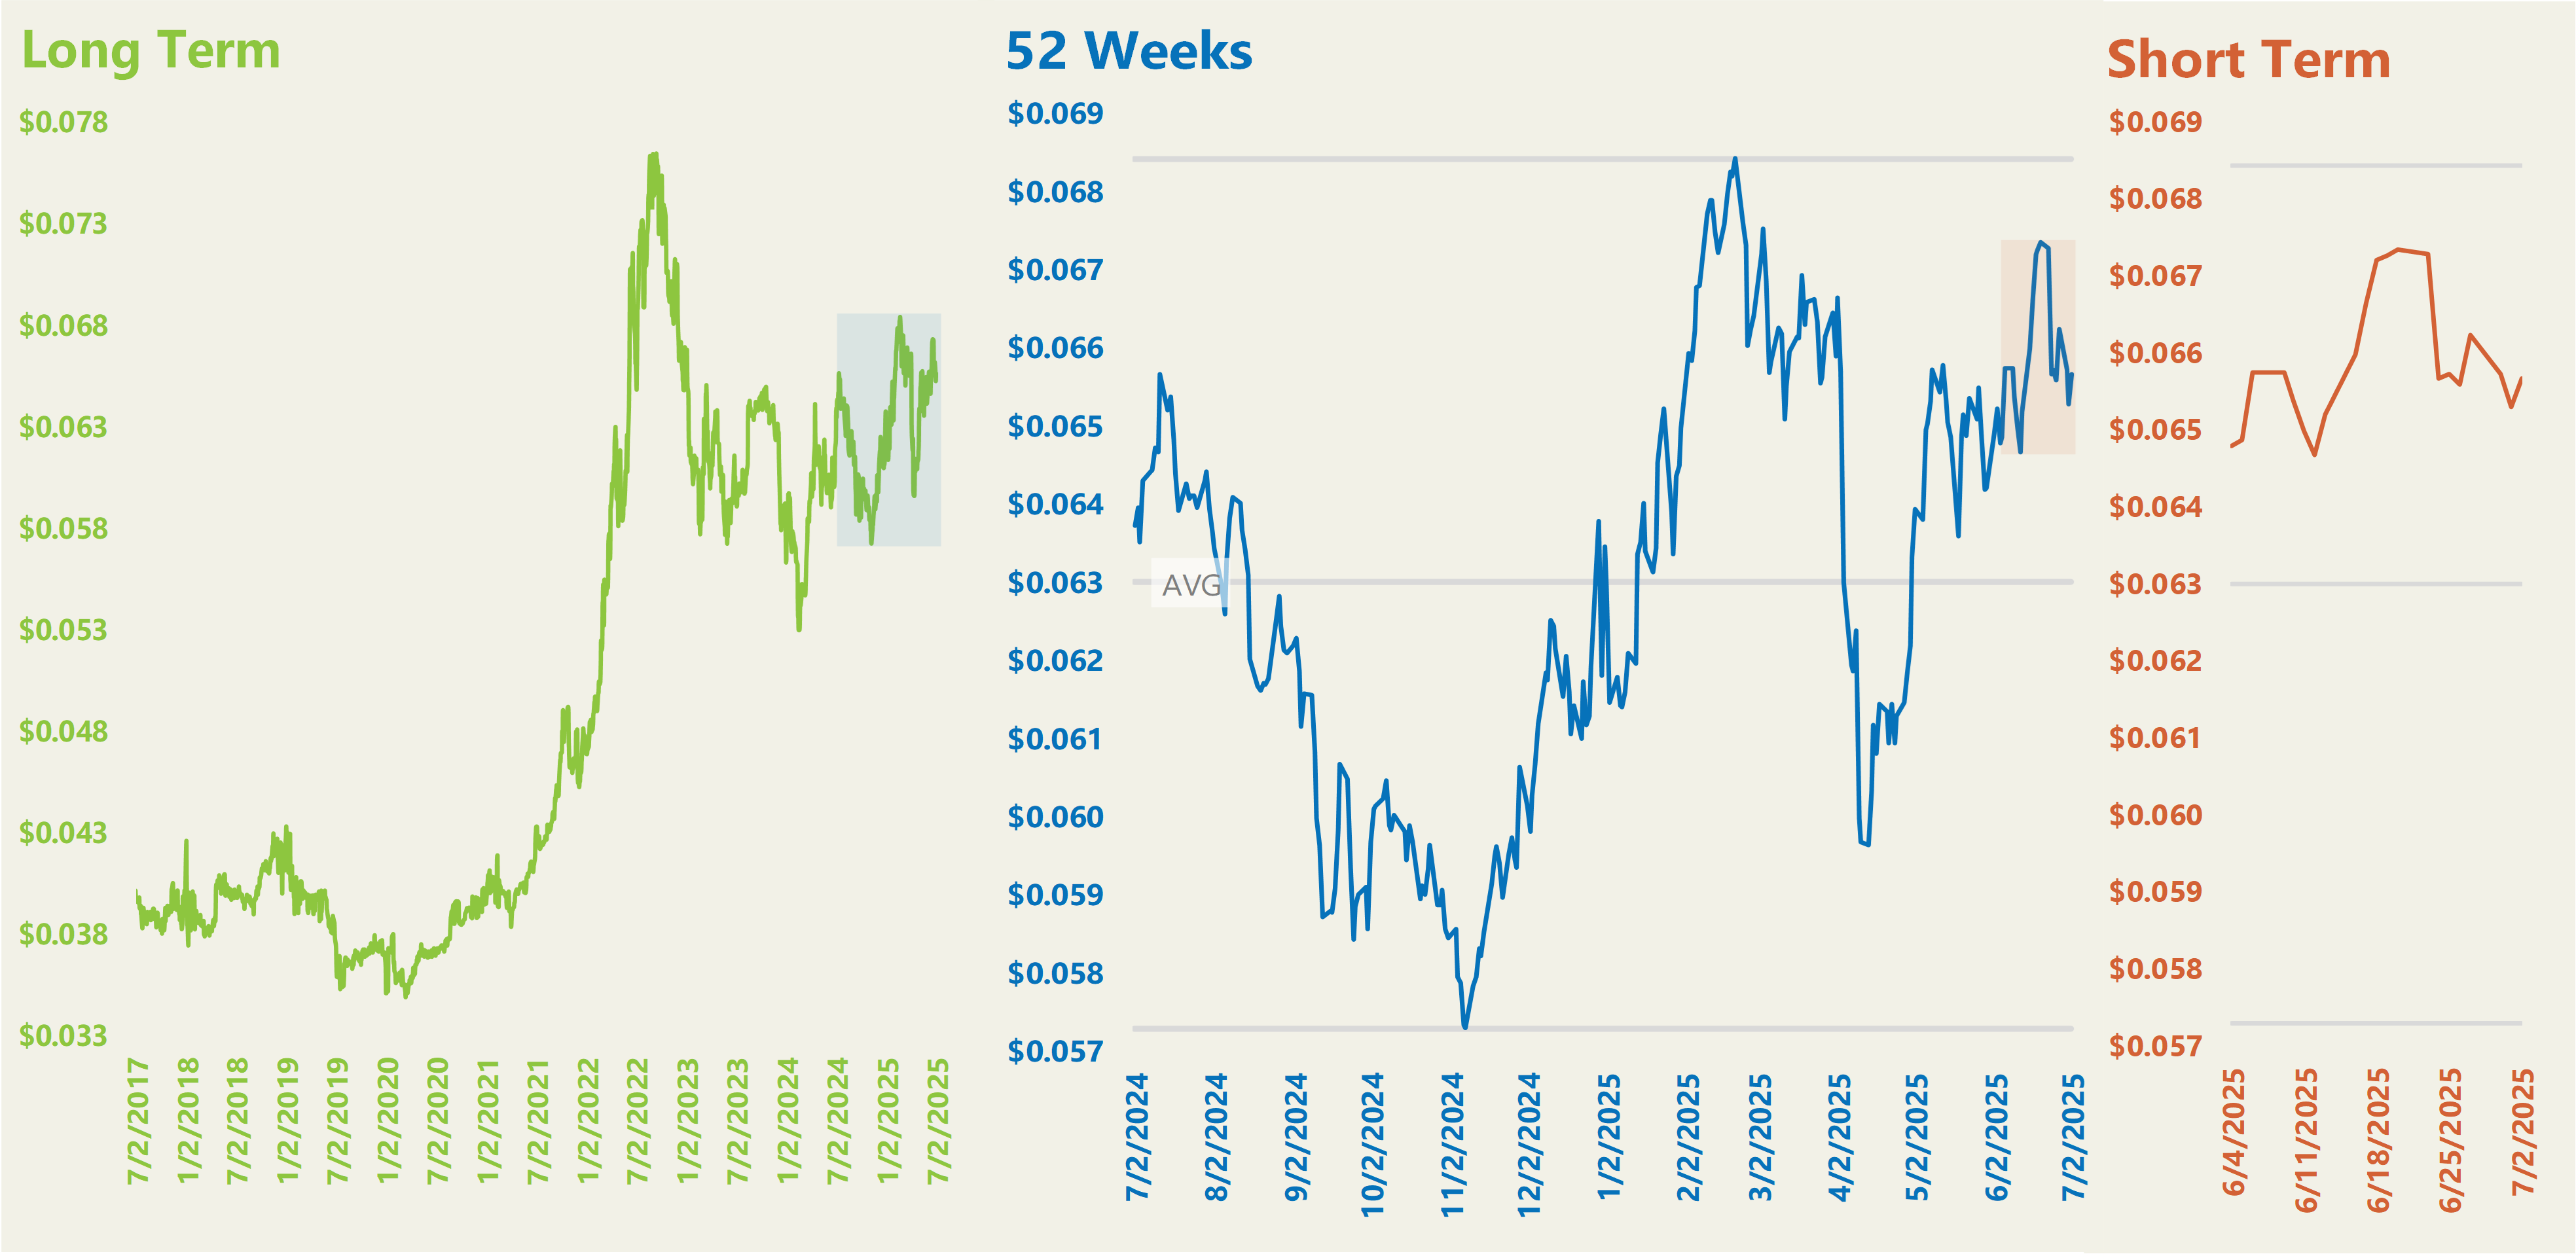
TETCO-M3
TETCO-M3 prices are currently down about 5.5% from the 52-week high on June 19, which is roughly 9.5% above the average.
TETCO-M3 Wholesale Calendar Year 2026 Week to Week Fluctuation ($/Therm)
The graphs above show the price movement of Calendar Year 2026 TETCO-M3 Wholesale Naural Gas over various periods of time. The price of the calendar year is shown on the left y-axis in relation to the date of the pricing on the bottom x-axis. On the 52-week and short-term graphs, you can see the minimum, maximum, and average prices of the past 52 weeks indicated by the gray lines.
PJM Western Hub
PJM prices are currently down about 3.1% from the 52-week high on March 24, which is about 5.7% above the average.
PJM Western Hub ATC DA Wholesale Calendar Year 2026 Week to Week Fluctuation ($/kWh)
The graphs above show the price movement of Calendar Year 2026 PJM Western Hub ATC DA Wholesale Electricity over various periods of time. The price of the calendar year is shown on the left y-axis in relation to the date of the pricing on the bottom x-axis. On the 52-week and short-term graphs, you can see the minimum, maximum, and average prices of the past 52 weeks indicated by the gray lines.
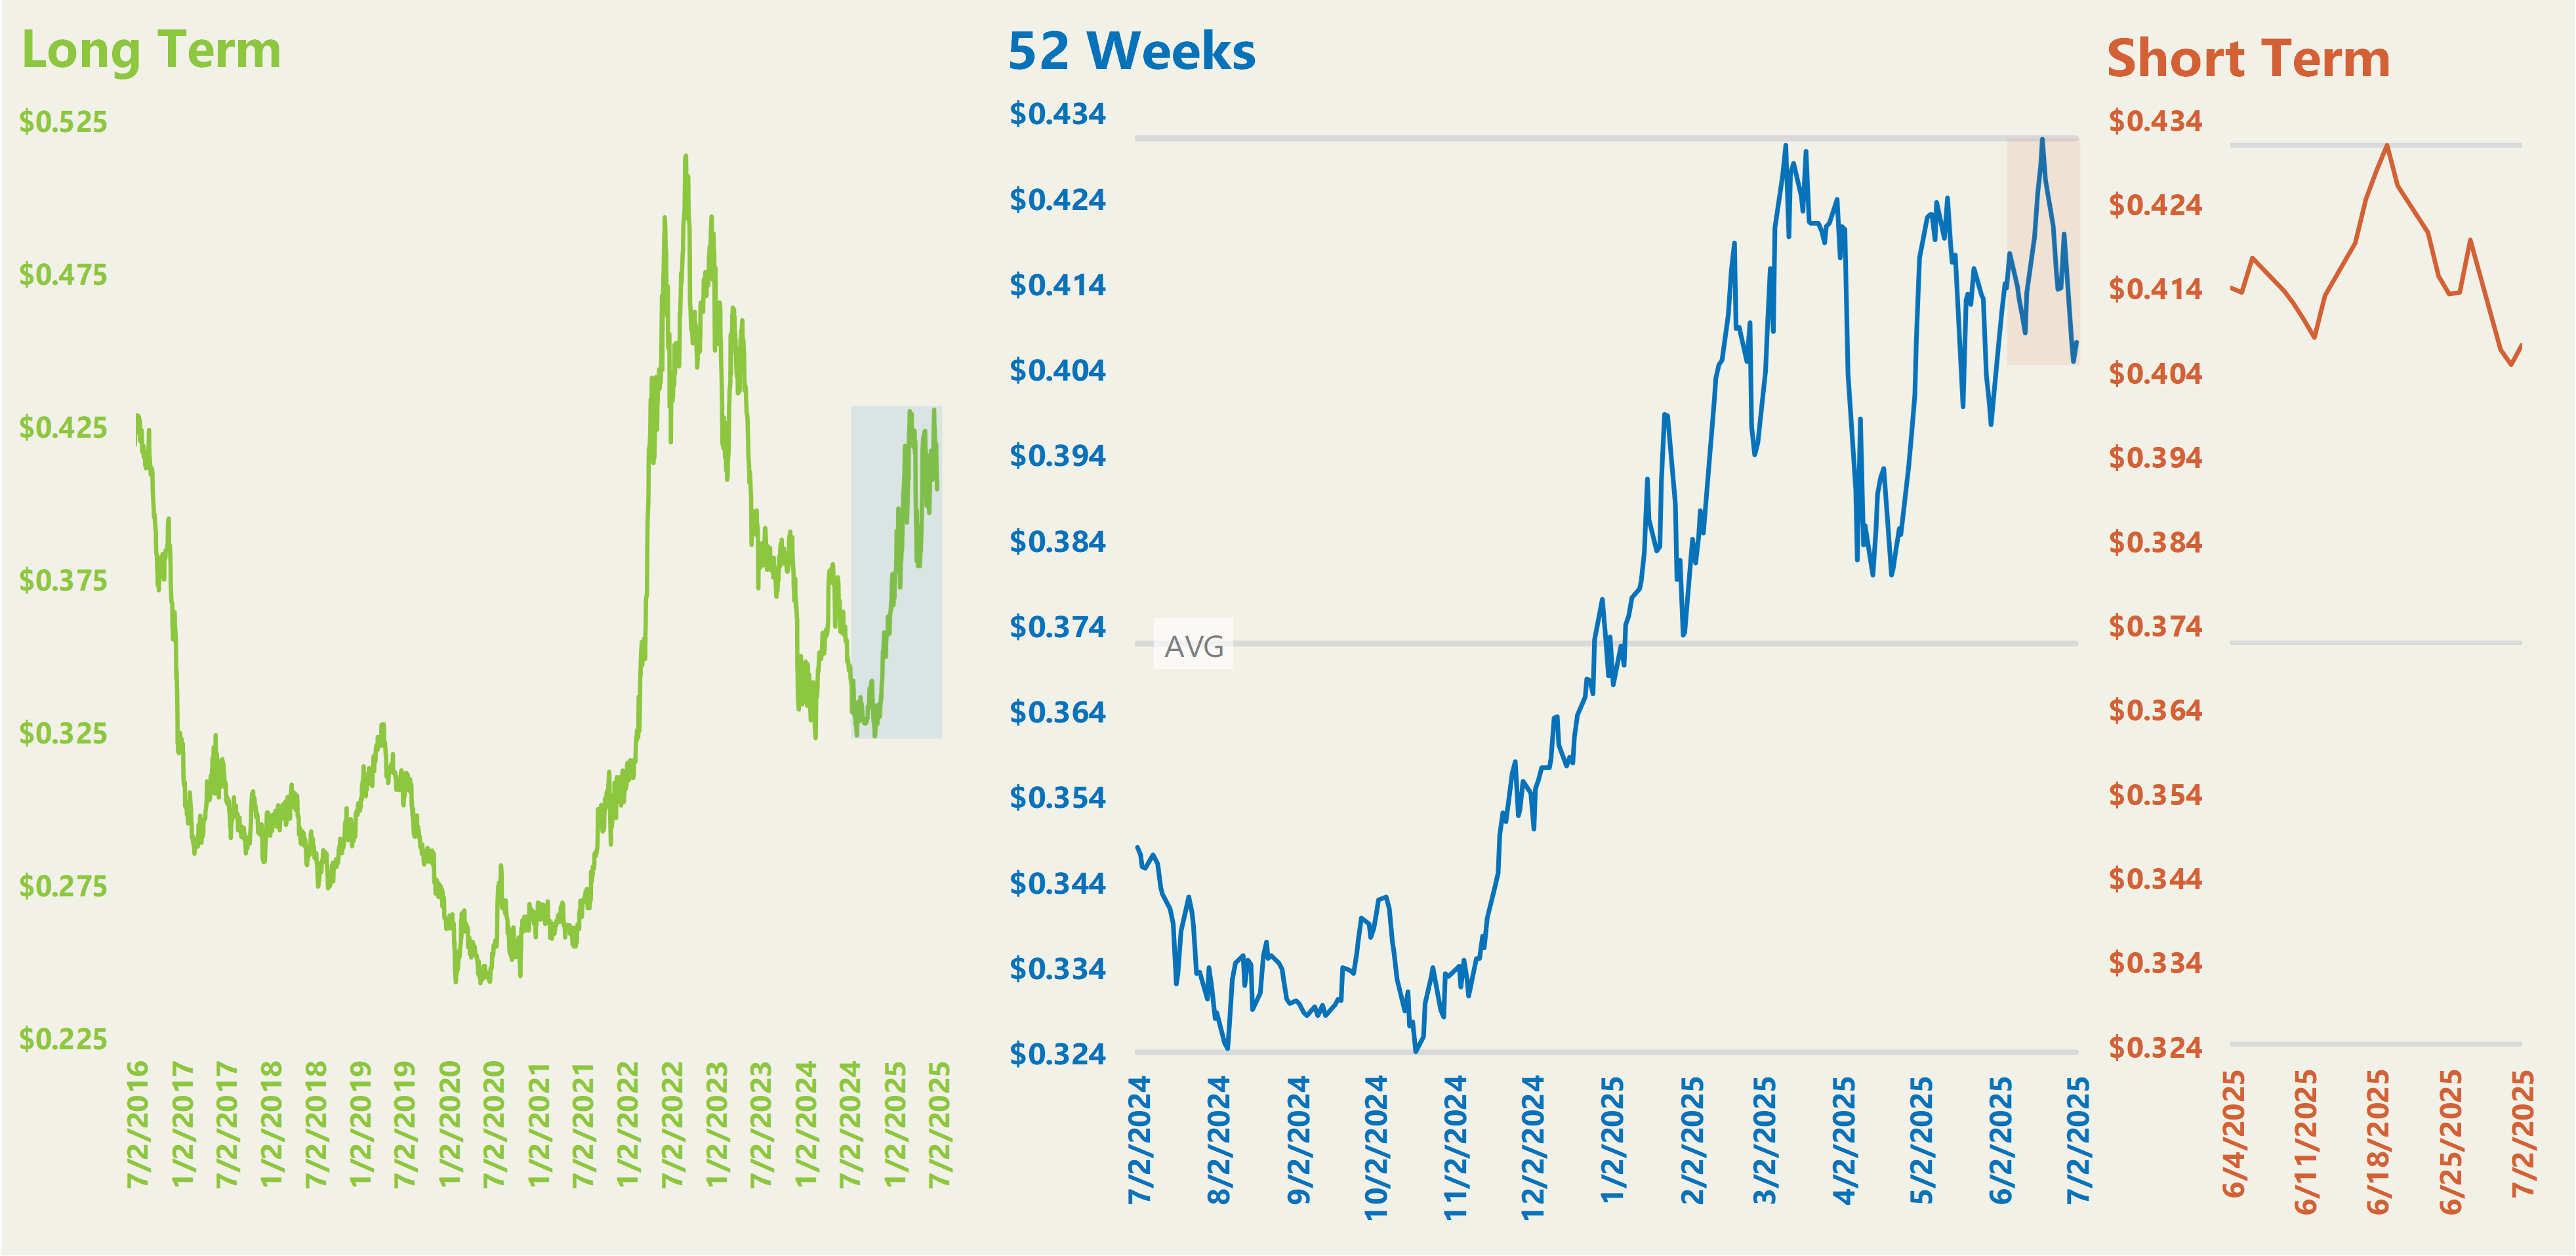
Houston Ship Channel
Houston Ship Channel (HSC) prices are currently down about 6.1% from the 52-week high on June 19, which is approximately 10.5% above the average.
Houston Ship Channel Wholesale Calendar Year 2026 Week to Week Fluctuation ($/Therm)
The graphs above show the price movement of Calendar Year 2026 Houston Ship Channel Wholesale Naural Gas over various periods of time. The price of the calendar year is shown on the left y-axis in relation to the date of the pricing on the bottom x-axis. On the 52-week and short-term graphs, you can see the minimum, maximum, and average prices of the past 52 weeks indicated by the gray lines.
ERCOT Houston
Houston prices are currently down about 12.1% from the 52-week high on March 19, which is around 1.9% above the average.
ERCOT Houston Load Zone ATC RT Wholesale Calendar Year 2026 Week to Week Fluctuation ($/kWh)
The graphs above show the price movement of Calendar Year 2026 ERCOT Houston Load Zone ATC RT Wholesale Electricity over various periods of time. The price of the calendar year is shown on the left y-axis in relation to the date of the pricing on the bottom x-axis. On the 52-week and short-term graphs, you can see the minimum, maximum, and average prices of the past 52 weeks indicated by the gray lines.
General Disclaimer: This information is provided as a courtesy to our clients and/or potential clients and should not be construed as an offer to sell or as a solicitation of an offer to buy securities based on, or contracts in or for, any energy commodity. Mantis Innovation does not sell electricity and/or natural gas, and as such, the actual terms and conditions of competitive supply are solely provided for by the competitive supplier’s contract with the client. Reliance on this information for decisions is done so at the sole risk of the reader and past performance is not indicative of future results. This information is provided as a general description of various electricity and/or natural gas purchasing strategies that may be decided upon by our clients. Both clients and potential clients should consider their individual circumstances and other sources of available information before arriving at a decision. Graphs and charts are for illustrative purposes only.