


News | February 13, 2022
Market Update

This market update includes a natural gas storage update, electric and natural gas price movement, and a weather outlook. By utilizing this information, you can make better-informed energy decisions. This is general information to give you a quick summary of the market, please contact the energy solutions team at Mantis Innovation for additional information.
Natural Gas
The amount of natural gas available for usage is very important in the energy industry because, among other things, it is used for heating, and as a main fuel source for generating electricity at power plants to be consumed by both homes and businesses. By comparing current levels of natural gas storage to the levels of last year and the past five years, an assessment as to the state of natural gas supplies to meet demand can be made.

Final estimates for week ending 2/3/23 were for a withdrawal in the 201 to 203 Bcf range.
The total net withdrawal came in well above the final estimates, with 217 Bcf being taken out of storage.
Storage is now 233 Bcf above last year, and 117 Bcf above the 5-year average, which is still within the 5-year historical range.
Early market estimates for the storage report for week ending 2/10/23 are wide calling for a withdrawal in the 108 to 138 Bcf range.

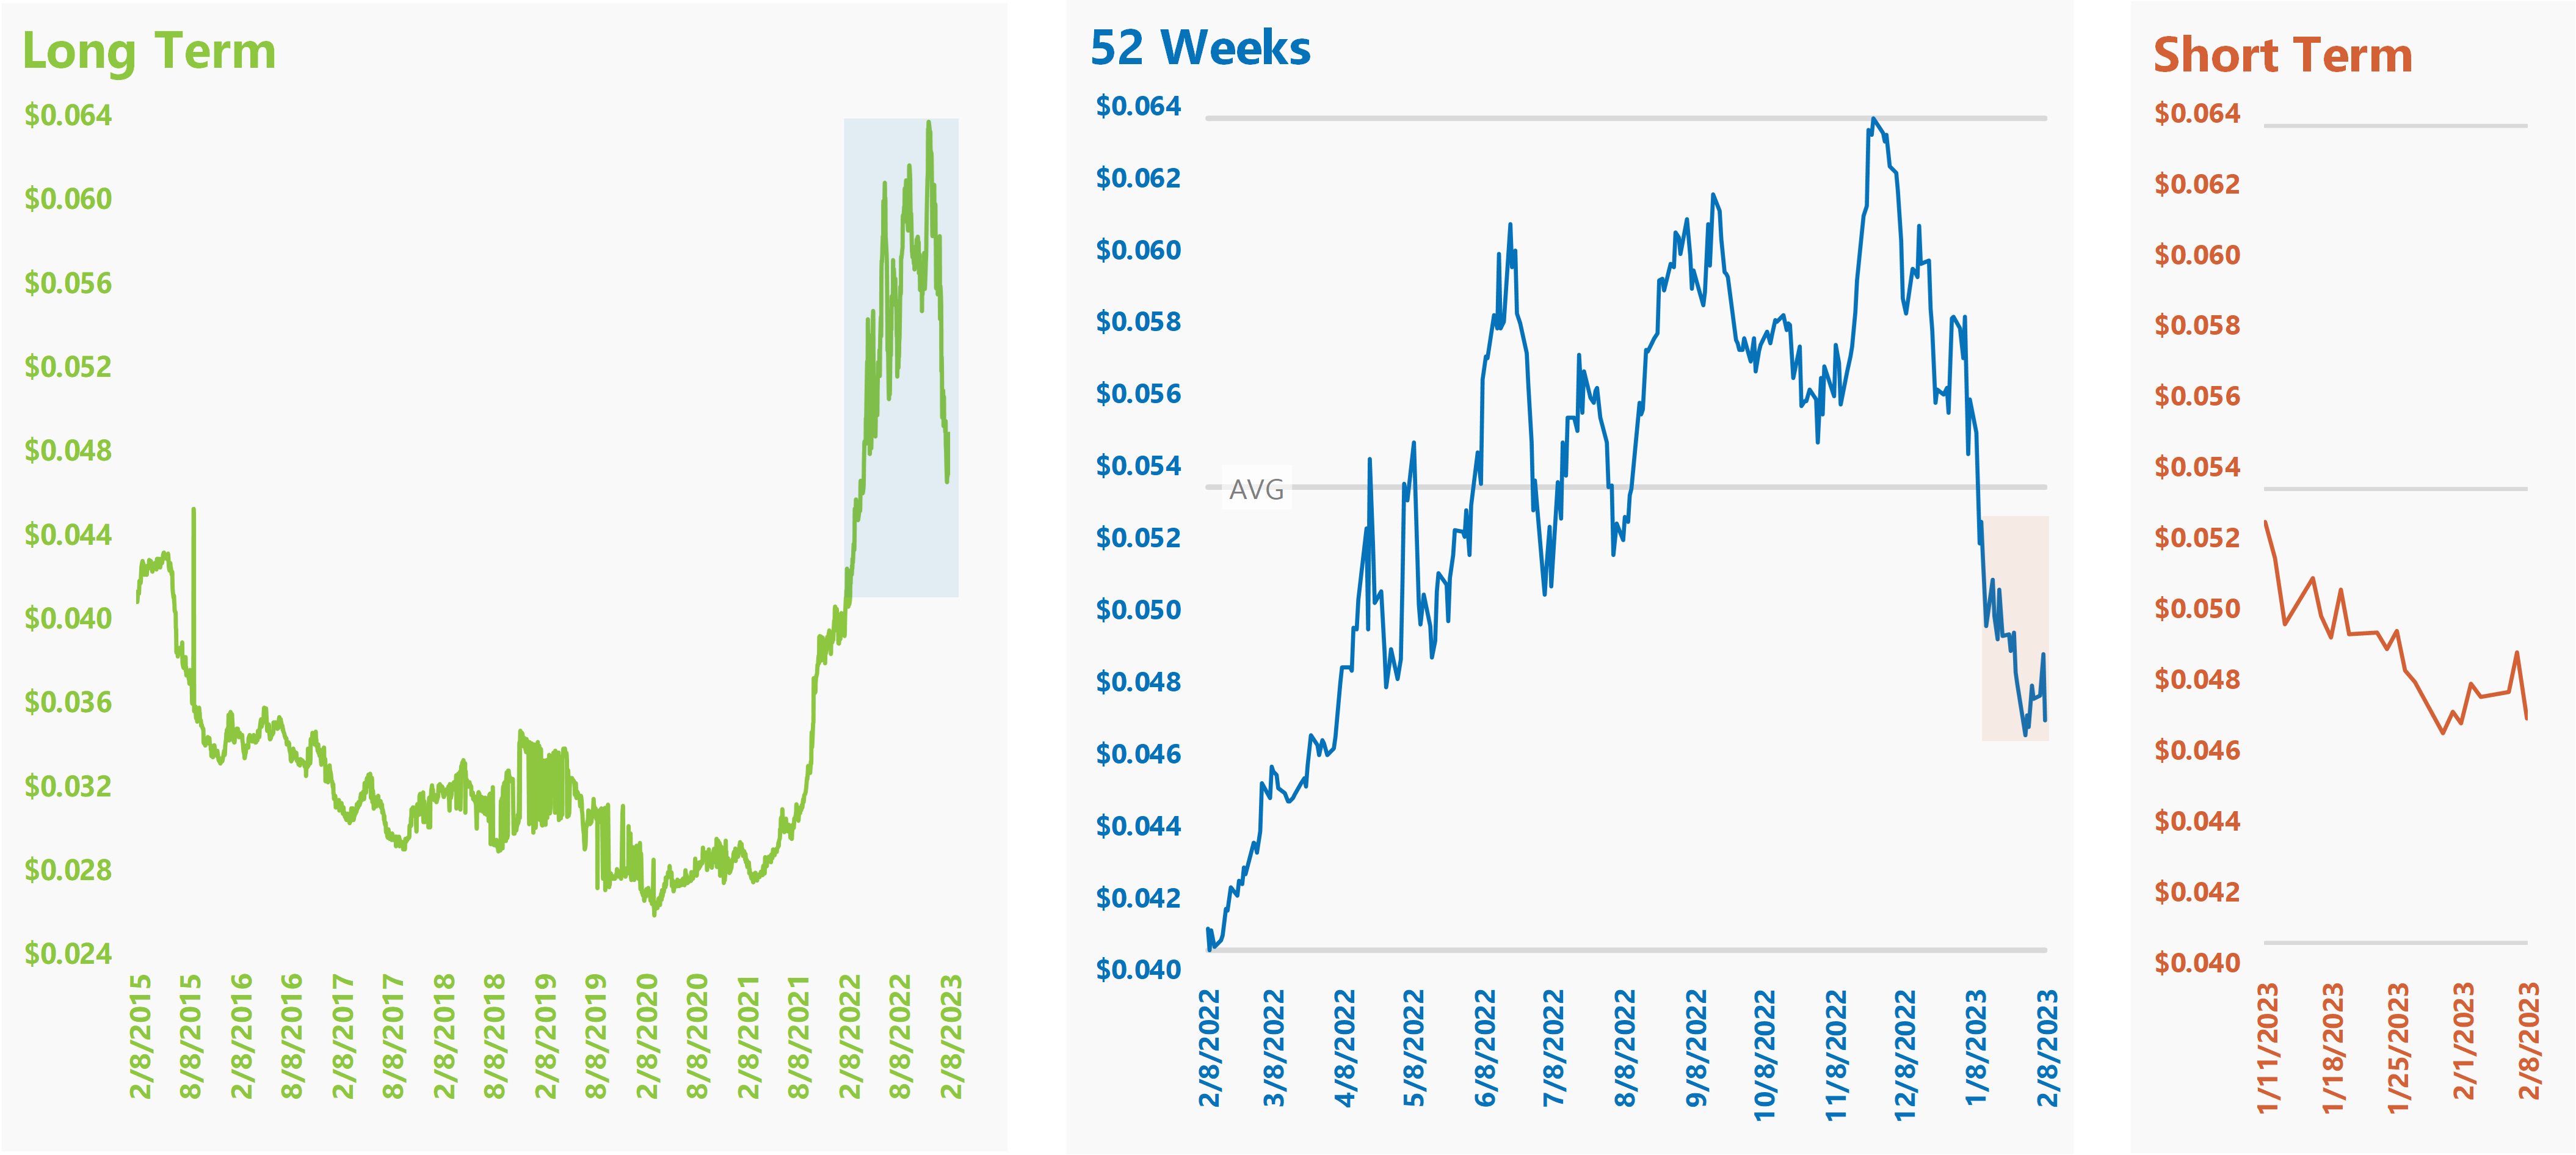
Henry Hub
Henry Hub Wholesale Calendar Year 2024 future prices started at the 52-week low in February last year. From there, future prices began a long rally up that continued until they established a high point in June. Following that, prices swung up and down, first with a significant drop into July, followed by a large rally up until the start of September that established the new 52-week high, before another large drop into October. Future prices continued to range above the 52-week average until the end of December when they dropped below the average. Since the start of the new year, prices have continued to move lower. Currently Henry Hub prices are down about 32.5% from September 1st’s 52-week high, which is below the average by around 17.7%.
Henry Hub Wholesale Calendar Year 2023 Week to Week Fluctuation ($/Therm)

The graphs above show the price movement of Calendar Year 2023 Henry Hub Wholesale Natural Gas over various periods of time. The price of the calendar year is shown on the left y-axis in relation to date of the pricing on the bottom x-axis. On the 52-week and short-term graphs you can see the minimum, maximum and average price of the past 52 weeks indicated by the gray lines.

The graph above takes a look at the basis between Henry Hub, TETCO-M3 and Algonquin. Typically, the further from the Henry Hub you are the more the basis cost is. Notice it was flat on the left at the beginning of the pandemic and has started to widen over the last 6 months due to supply concerns.
Algonquin City Gate
Algonquin Wholesale Calendar Year 2024 future prices started at the 52-week low in February last year. From there, 2024 future prices began a long rally up that continued until they established the new 52-week high in September. Since establishing the new high, future prices have continued to move downward with short price spikes along the way. Most recently future prices have pushed further below the 52-week average. Currently Algonquin prices are down about 47.2% from September 15th’s 52-week high, which is below the average by around 24.6%.
Algonquin Wholesale Calendar Year 2023 Week to Week Fluctuation ($/Therm)
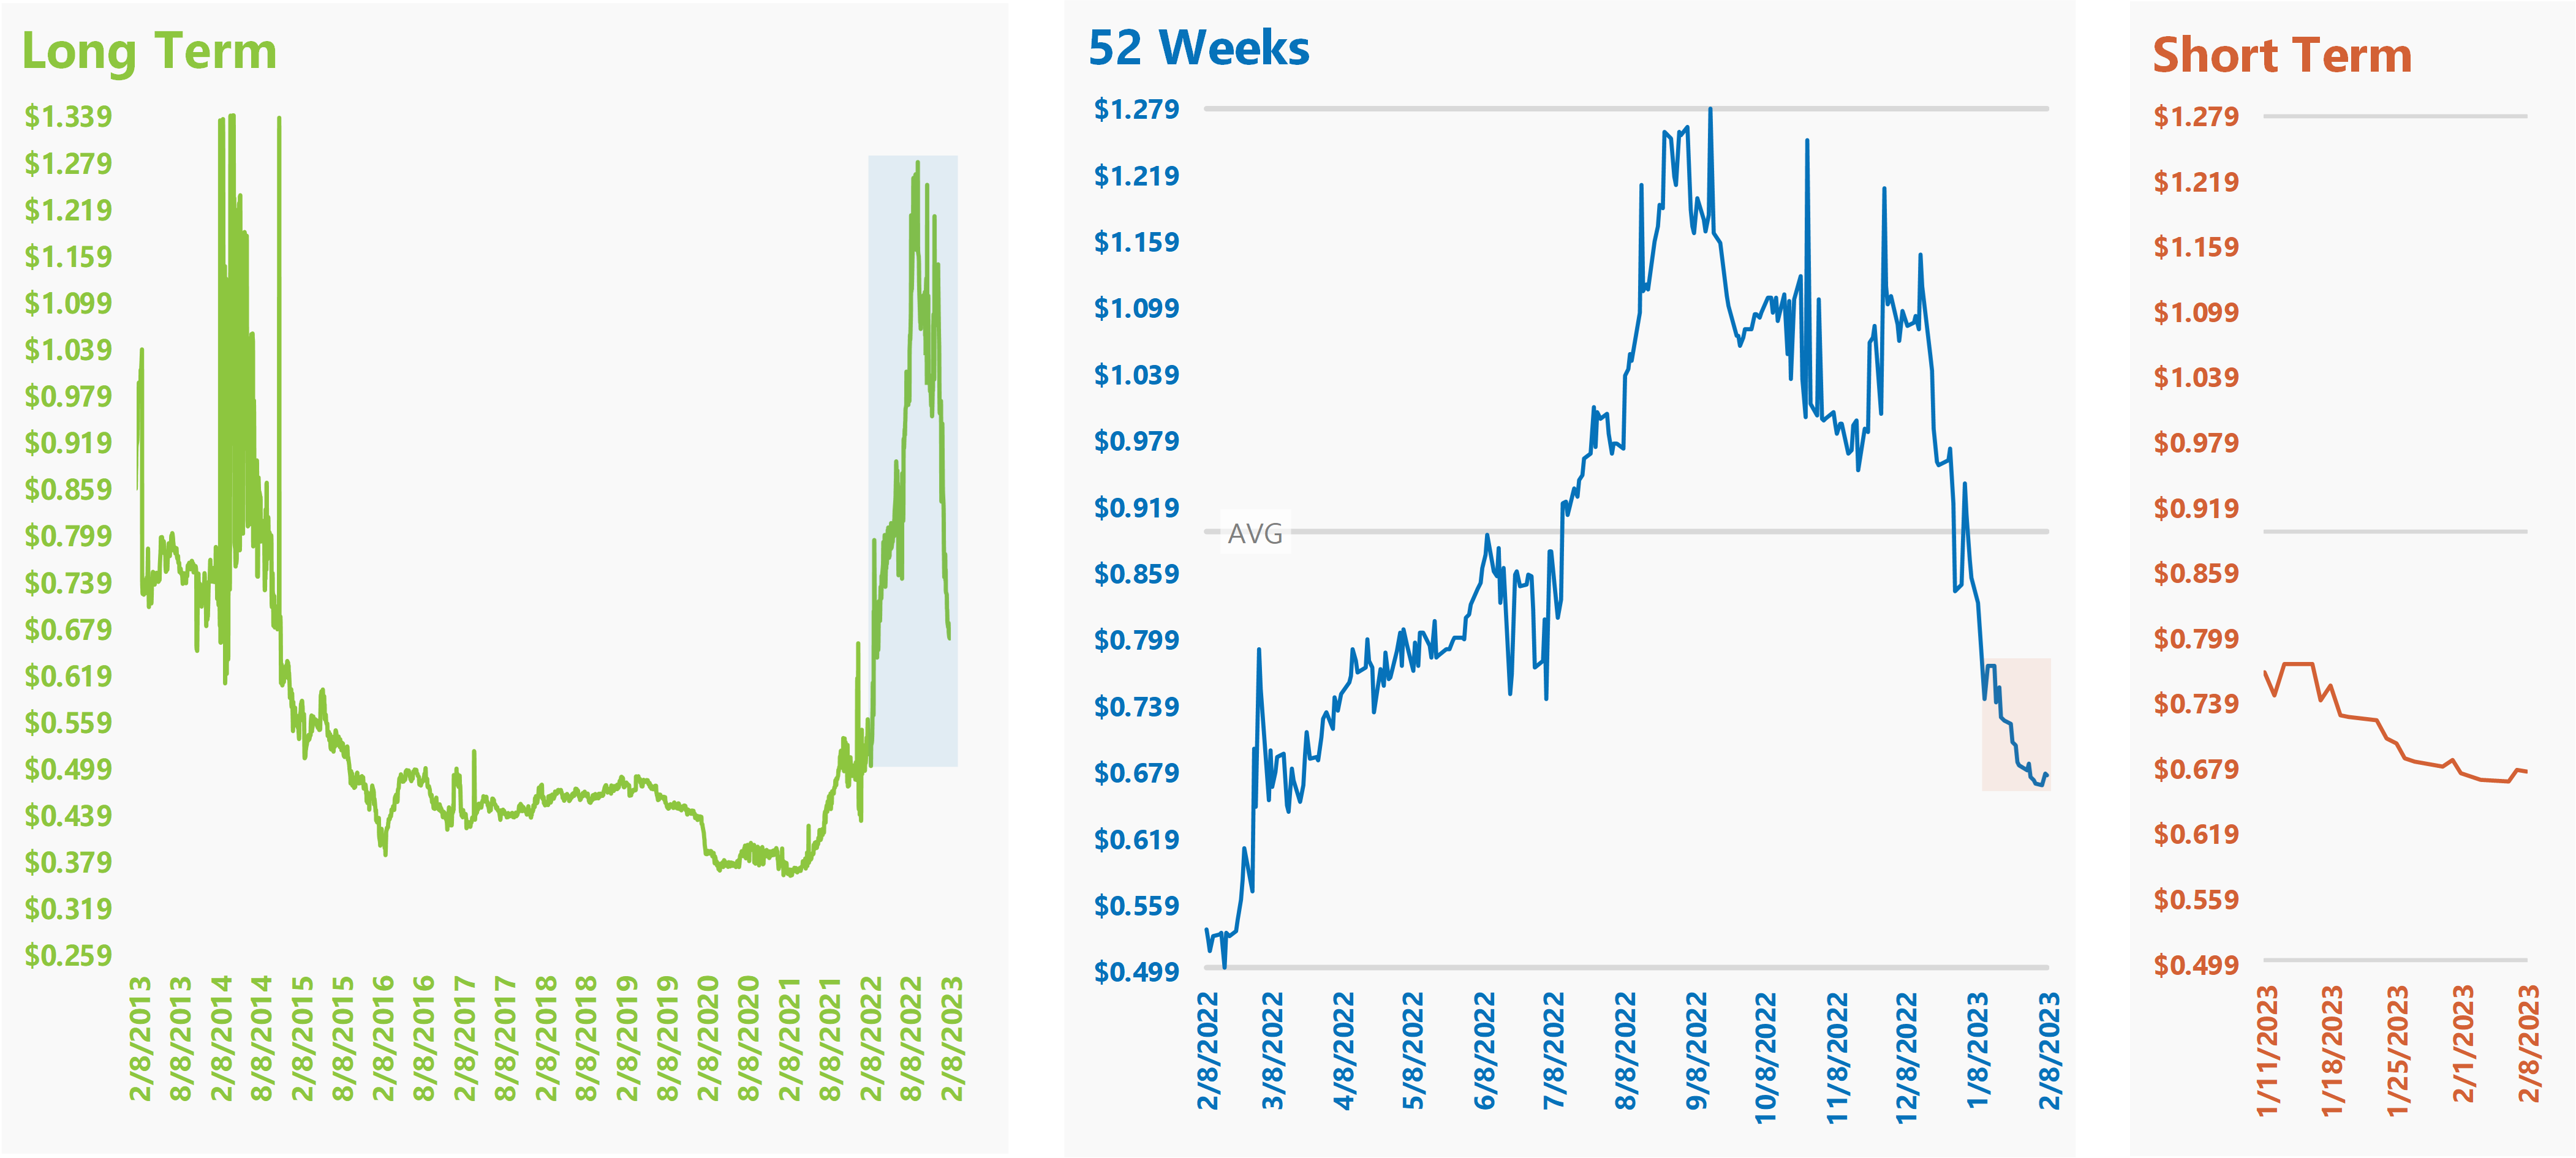
The graphs above show the price movement of Calendar Year 2023 Algonquin Wholesale Naural Gas over various periods of time. The price of the calendar year is shown on the left y-axis in relation to the date of the pricing on the bottom x-axis. On the 52-week and short-term graphs, you can see the minimum, maximum, and average prices of the past 52 weeks indicated by the gray lines.
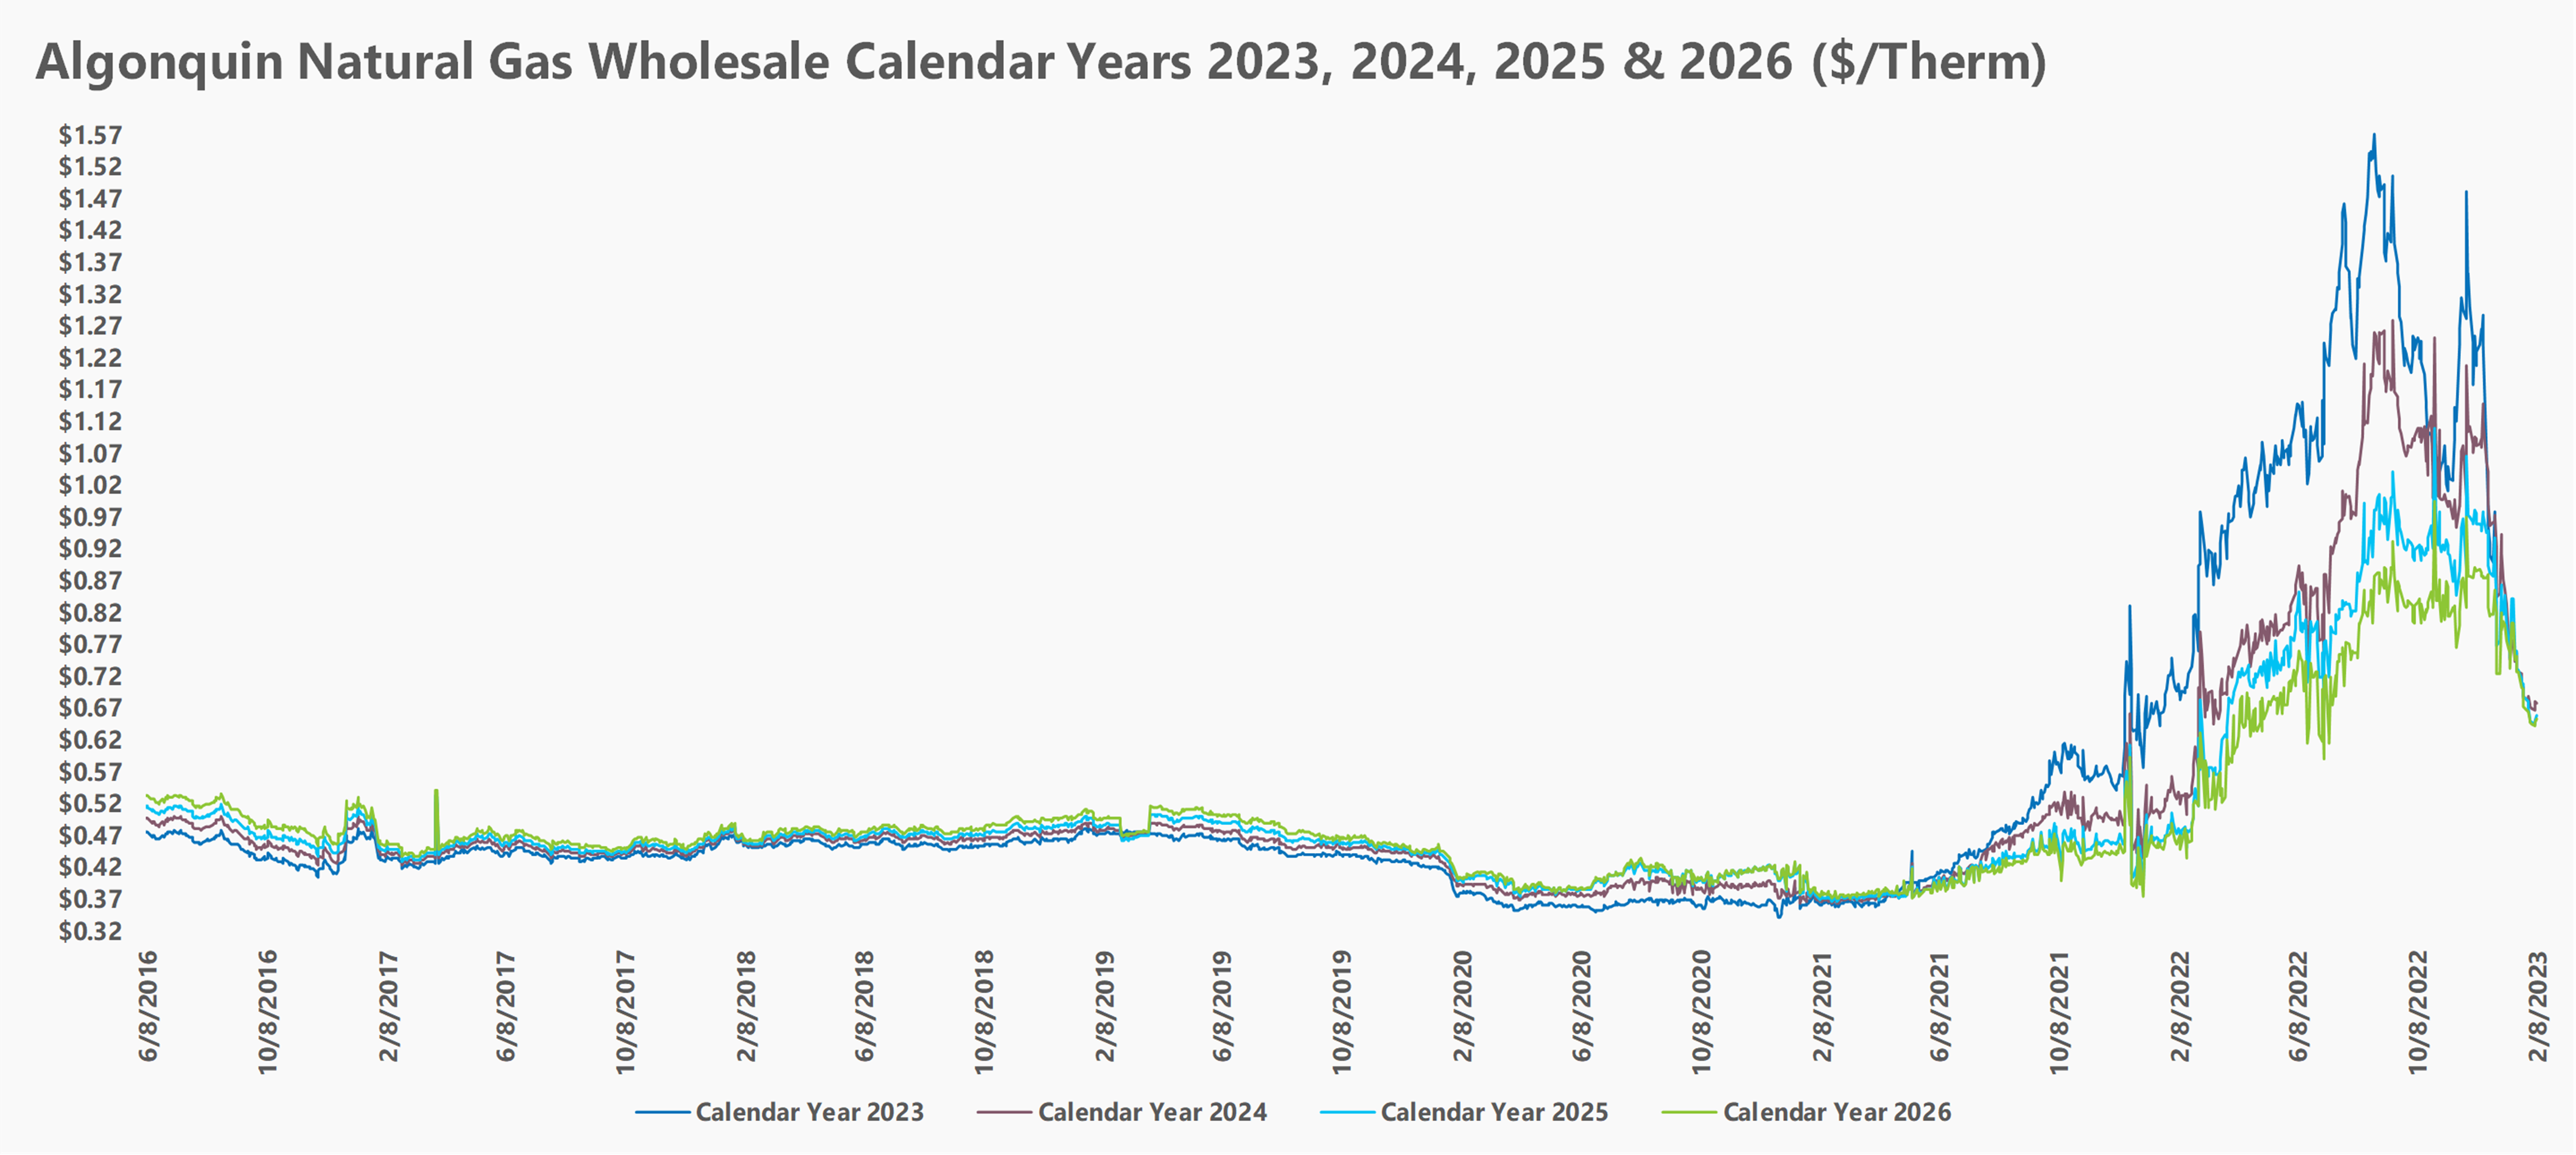
The graph above takes a look at Algonquin Natural Gas Wholesale Calendar Years 2022, 2023, 2024, and 2025 together.
ISO-NE
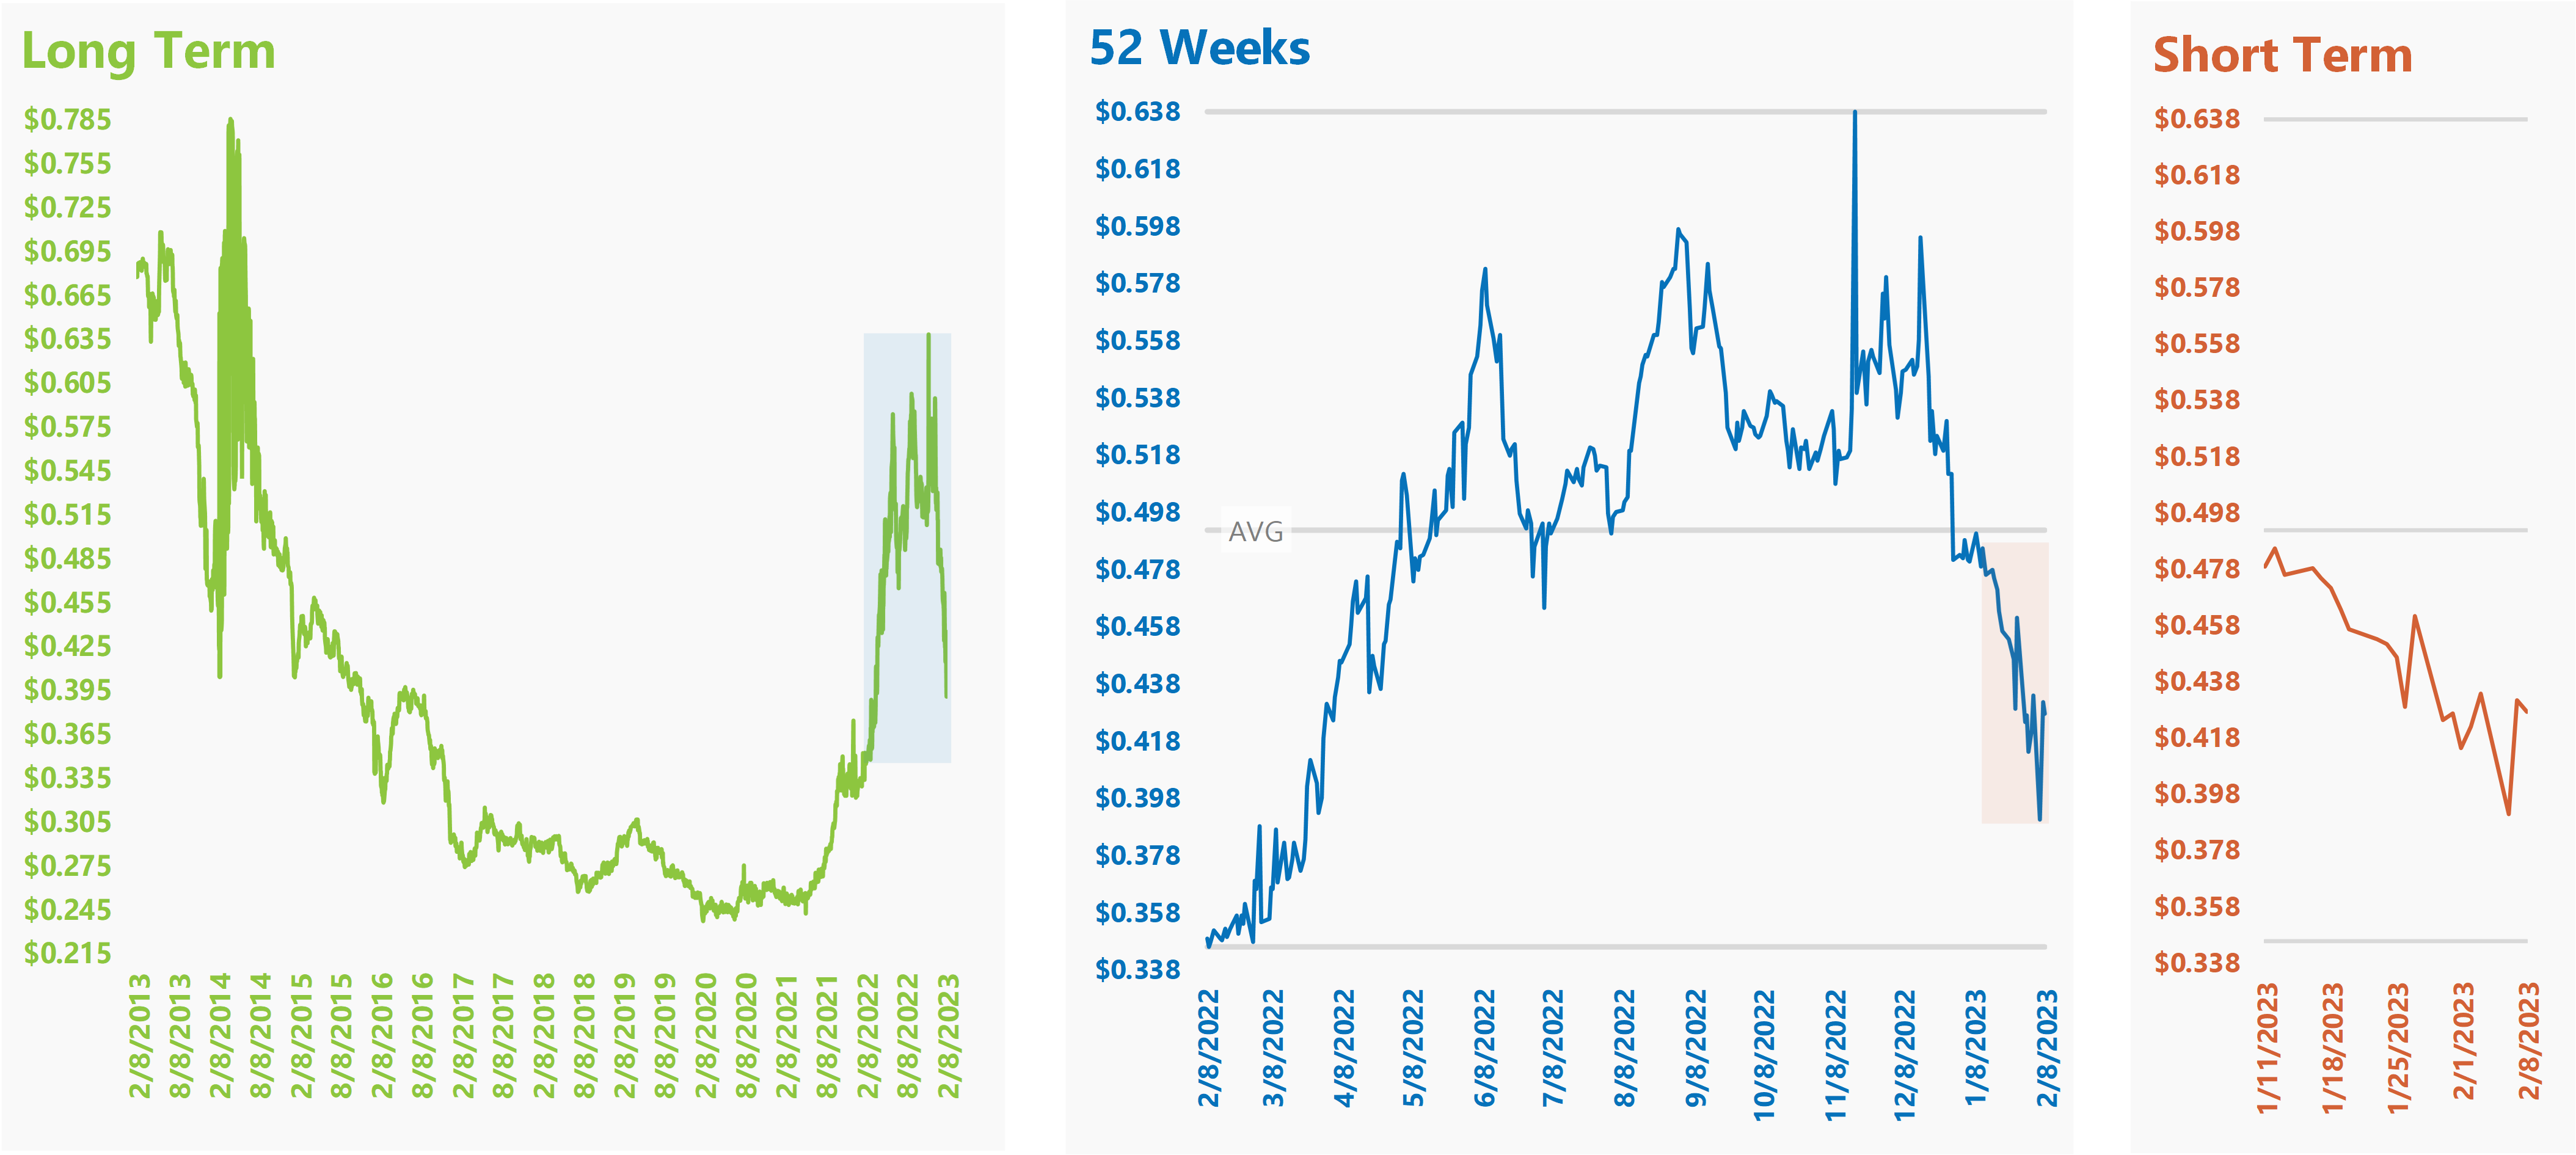
ISO-NE Wholesale Internal Hub Around-the-Clock Calendar Year 2024 future prices started at the 52-week low in February last year. From there, 2024 future prices began a long rally up that continued until they established the new 52-week high at the end of August. Since then, future prices have continued to move downward, and most recently prices have pushed further below the 52-week average. Currently ISO-NE prices are down about 36.9% from August 31st’s 52-week high, which is below the average by around 15.5%.
ISO-NE Internal Hub ATC DA Wholesale Calendar Year 2023 Week to Week Fluctuation ($/kWh)

The graphs above show the price movement of Calendar Year 2023 ISO-NE Internal Hub ATC DA Wholesale Electricity over various periods of time. The price of the calendar year is shown on the left y-axis in relation to the date of the pricing on the bottom x-axis. On the 52-week and short-term graphs, you can see the minimum, maximum, and average prices of the past 52 weeks indicated by the gray lines.
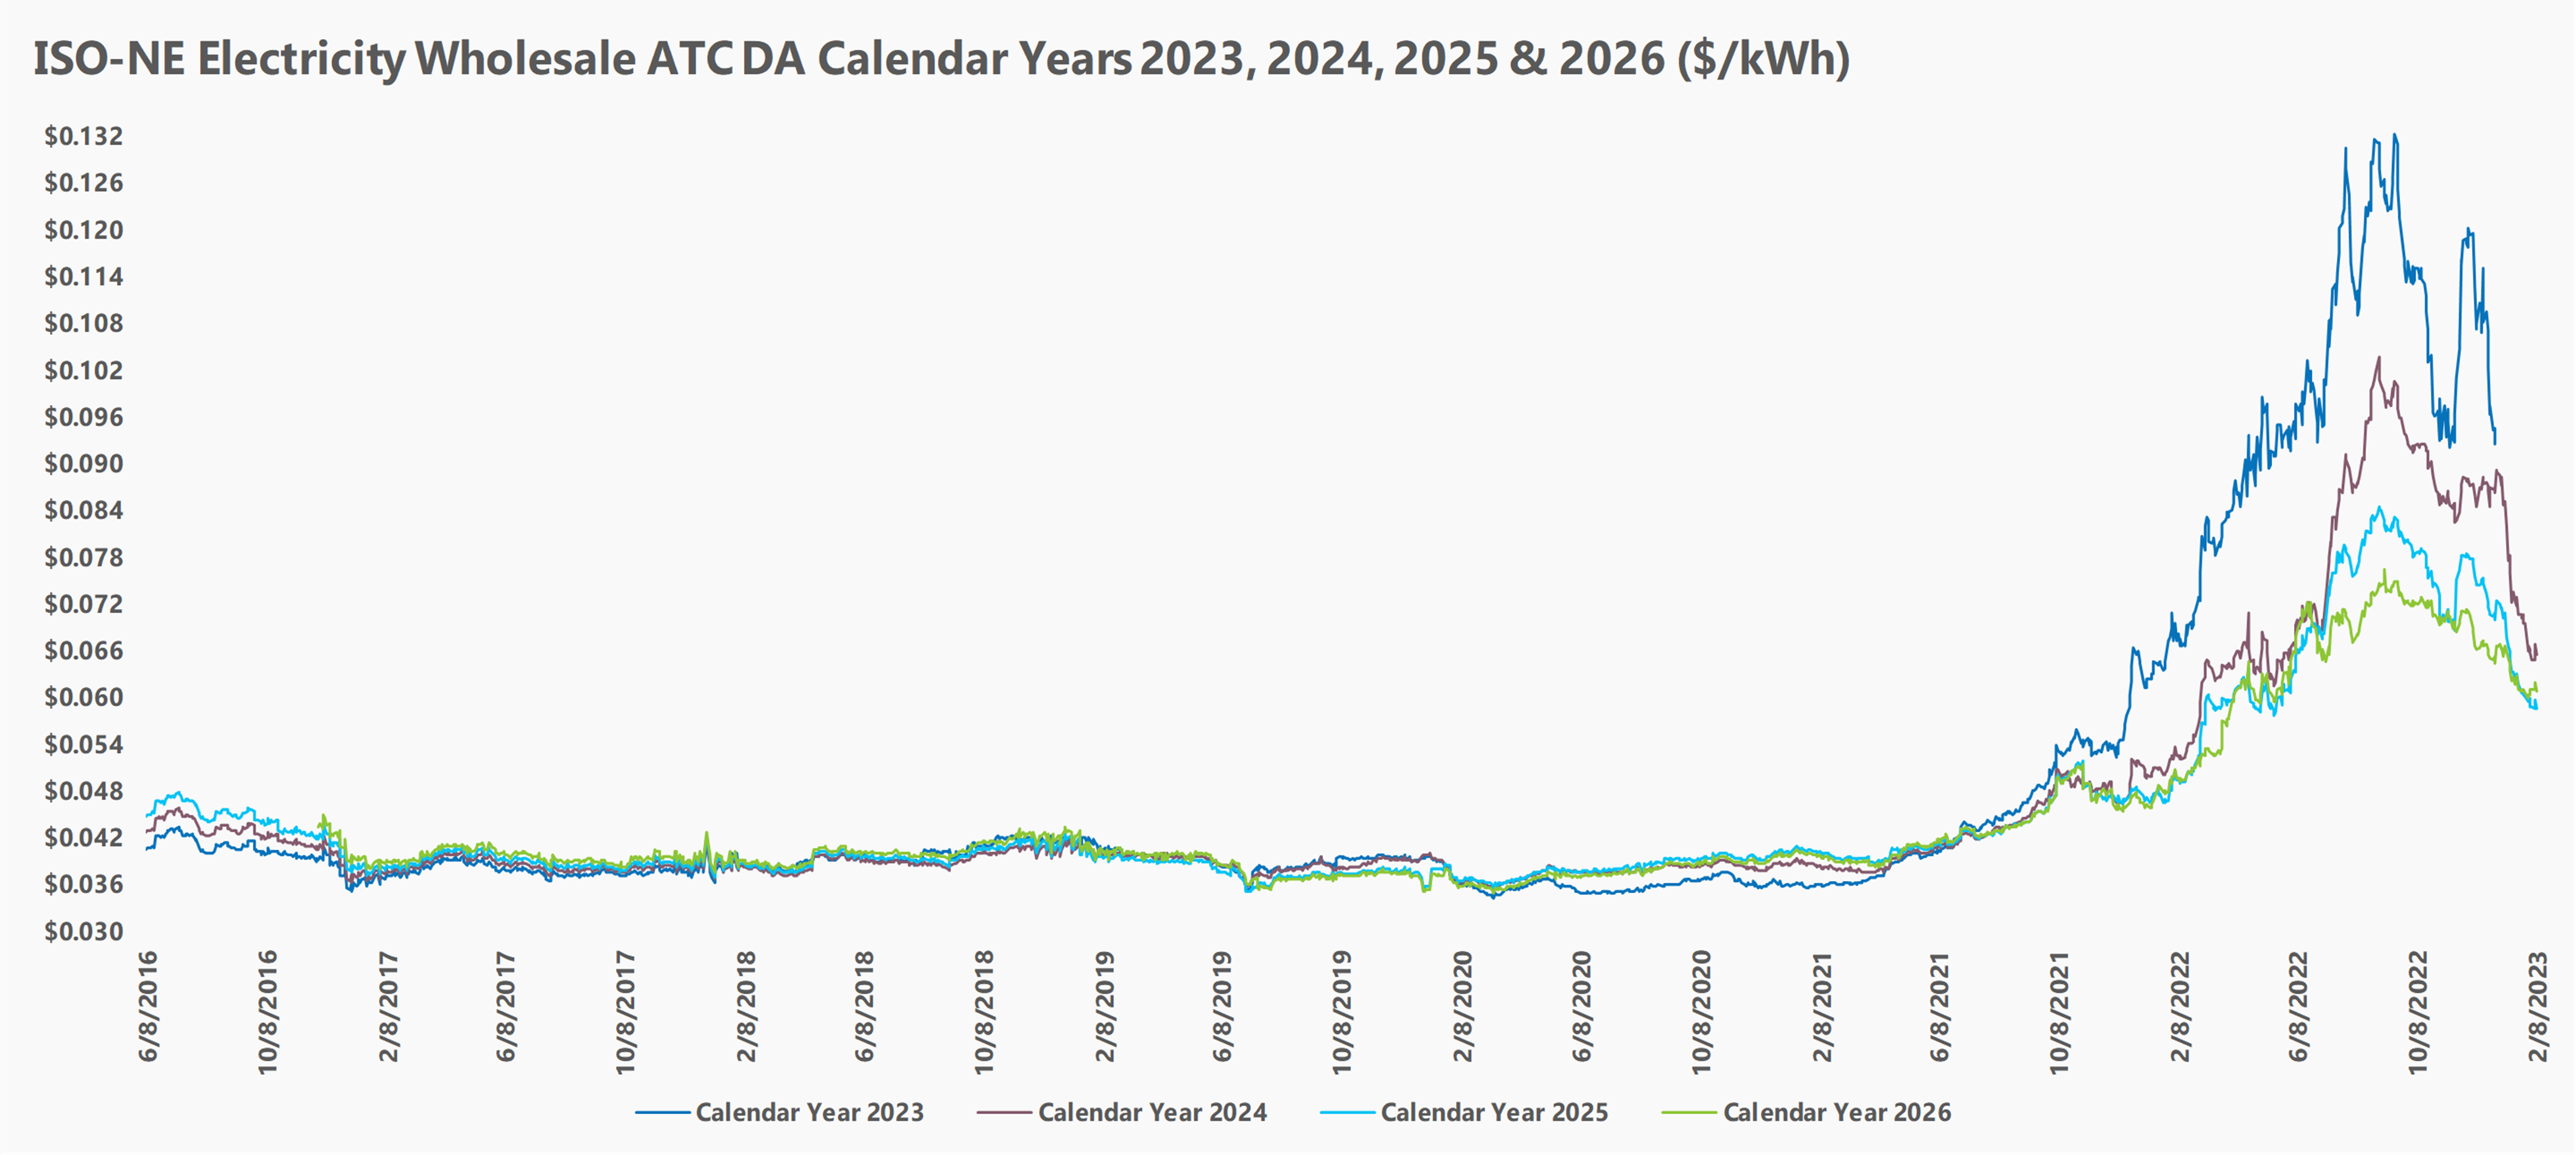
The graph above takes a look at ISO-NE Internal Hub ATC DA Wholesale Electricity Calendar Years 2022, 2023, 2024 and 2025 together.
TETCO-M3
TETCO-M3 Wholesale Calendar Year 2024 future prices started at the 52-week low in February last year. From there, future prices began a long rally up that continued until hitting a high point at the start of June. Following that, prices swung up and down, first with a significant drop into the start of July, followed by a large rally up until the start of September, that was followed by another drop into the start of November. Next future prices spiked sharply to establish the new 52-week high later in November. Recently prices have had a large drop down from the high, and they have just moved further below the 52-week average. Currently TETCO-M3 prices are down about 33% from November 17th’s 52-week high, which is below the average by around 13.2%.
TETCO-M3 Wholesale Calendar Year 2023Week to Week Fluctuation ($/Therm)
The graphs above show the price movement of Calendar Year 2023 TETCO-M3 Wholesale Naural Gas over various periods of time. The price of the calendar year is shown on the left y-axis in relation to the date of the pricing on the bottom x-axis. On the 52-week and short-term graphs, you can see the minimum, maximum, and average prices of the past 52 weeks indicated by the gray lines.
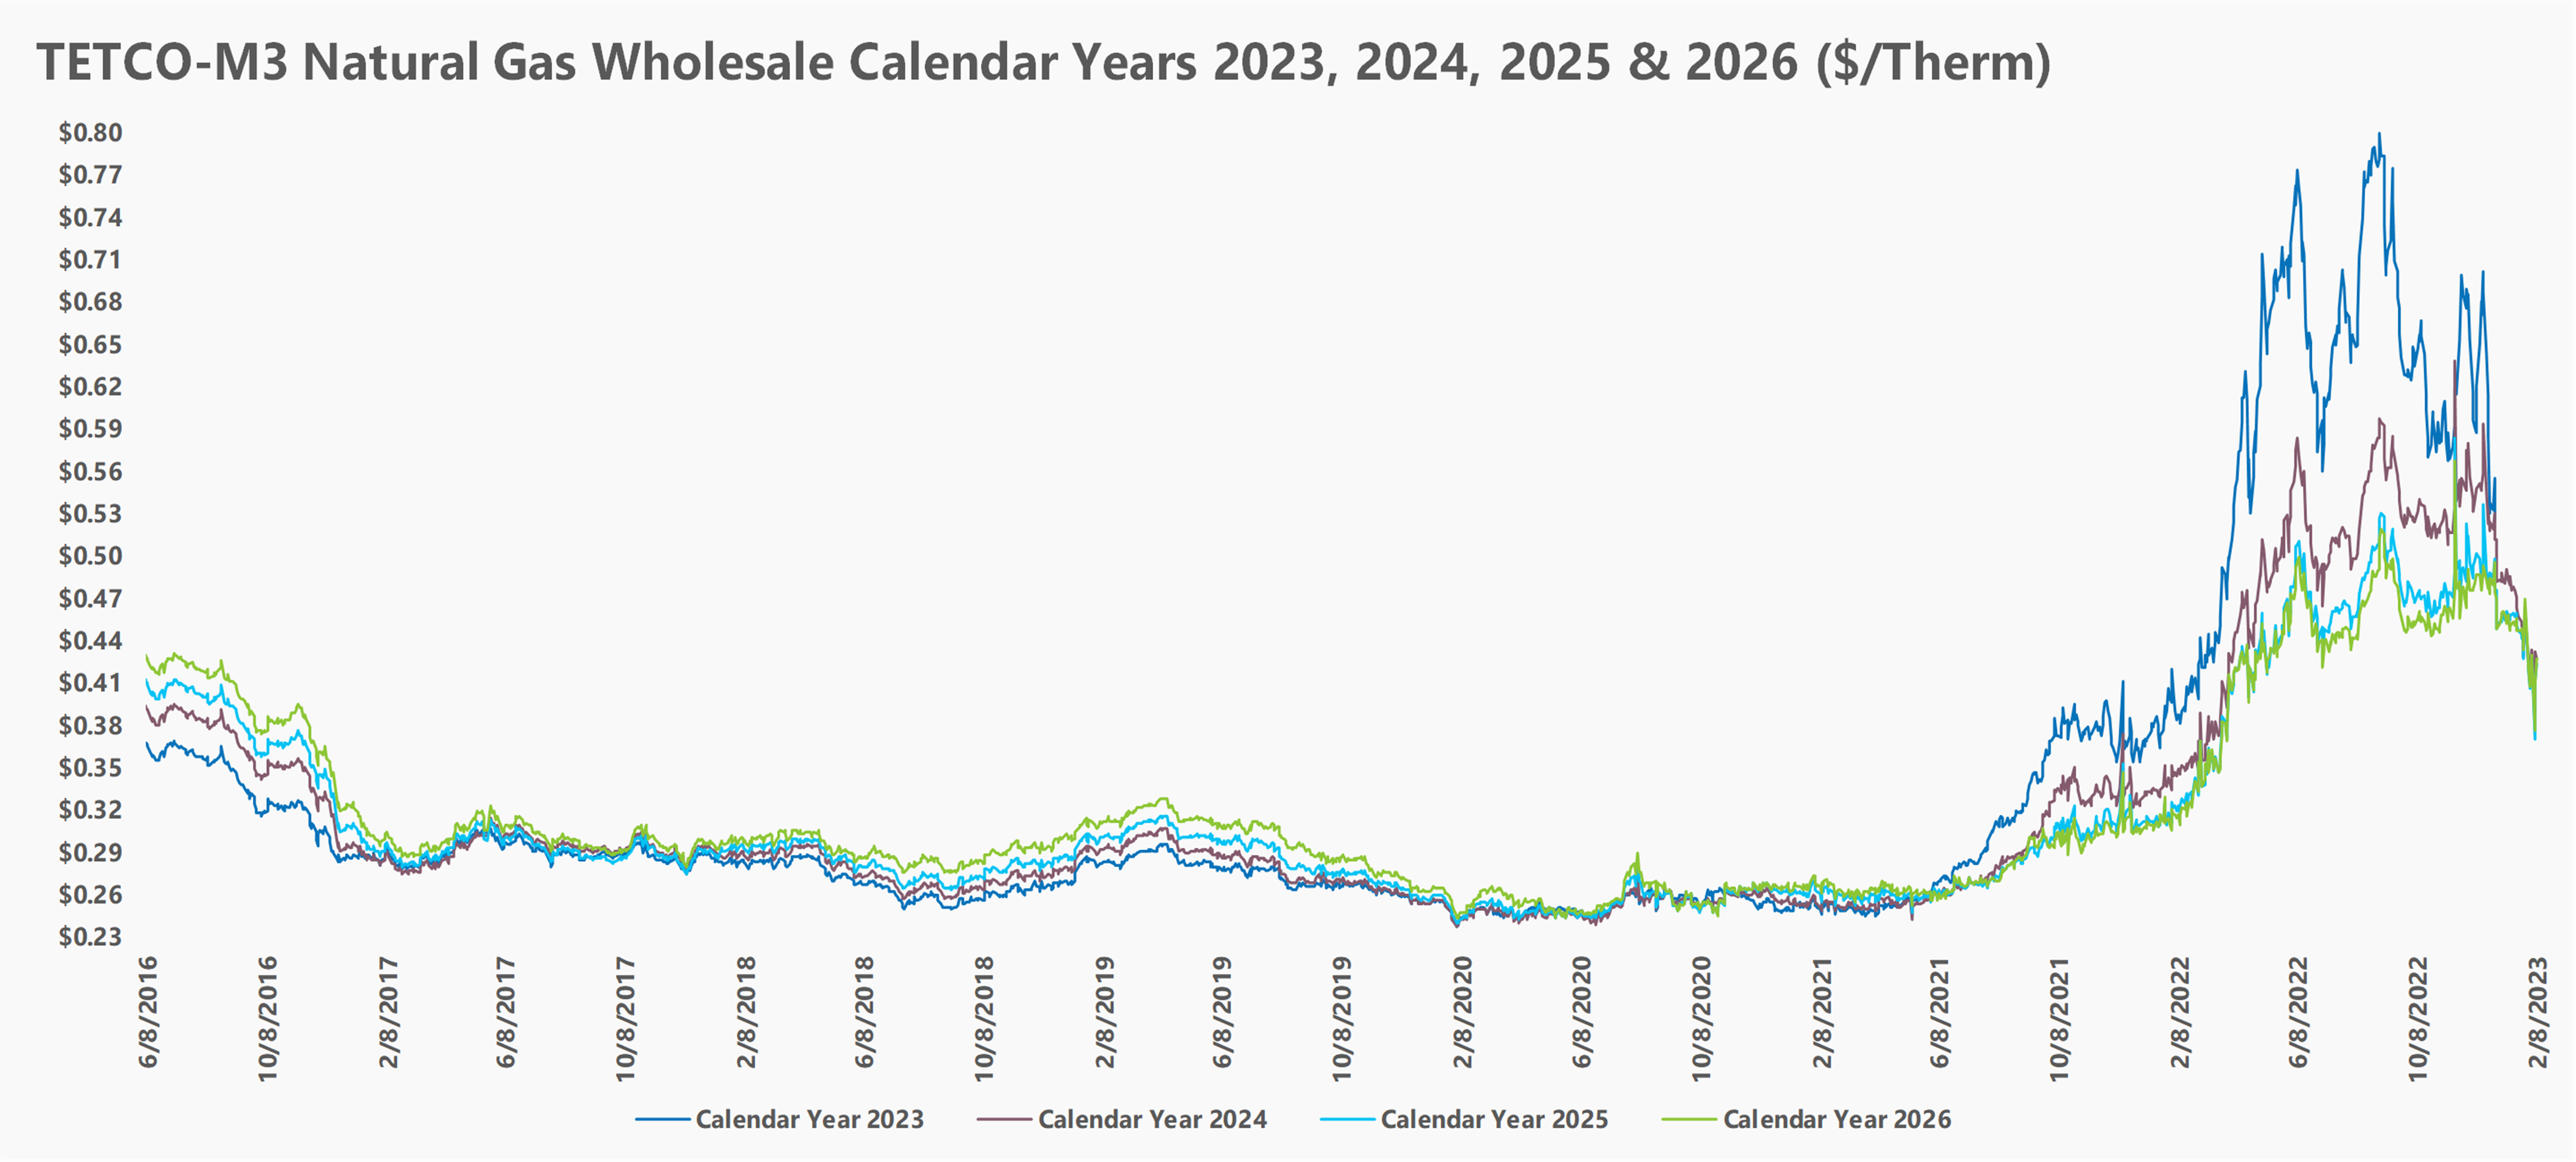
The graph above takes a look at TETCO-M3 Natural Gas Wholesale Calendar Years 2022, 2023, 2024, and 2025 together.
PJM Western Hub
PJM Wholesale Western Hub Around-the-Clock Calendar Year 2024 future prices started at the 52-week low in February last year. From there, future prices began a long rally up that continued until they established a high point in June. Following that, prices swung up and down, first with a significant drop into the start of July, followed by a large rally up into September, that was followed by another drop into the start of November. Next future prices spiked sharply to establish the new 52-week high later in November. Recently future prices have had a large drop down from the high, and they have just moved further below the 52-week average. Currently PJM prices are down about 26.3% from November 25th’s 52-week high, which is below the average by around 12.2%.
PJM Western Hub ATC DA Wholesale Calendar Year 2023 Week to Week Fluctuation ($/kWh)
The graphs above show the price movement of Calendar Year 2023 PJM Western Hub ATC DA Wholesale Electricity over various periods of time. The price of the calendar year is shown on the left y-axis in relation to the date of the pricing on the bottom x-axis. On the 52-week and short-term graphs, you can see the minimum, maximum, and average prices of the past 52 weeks indicated by the gray lines.
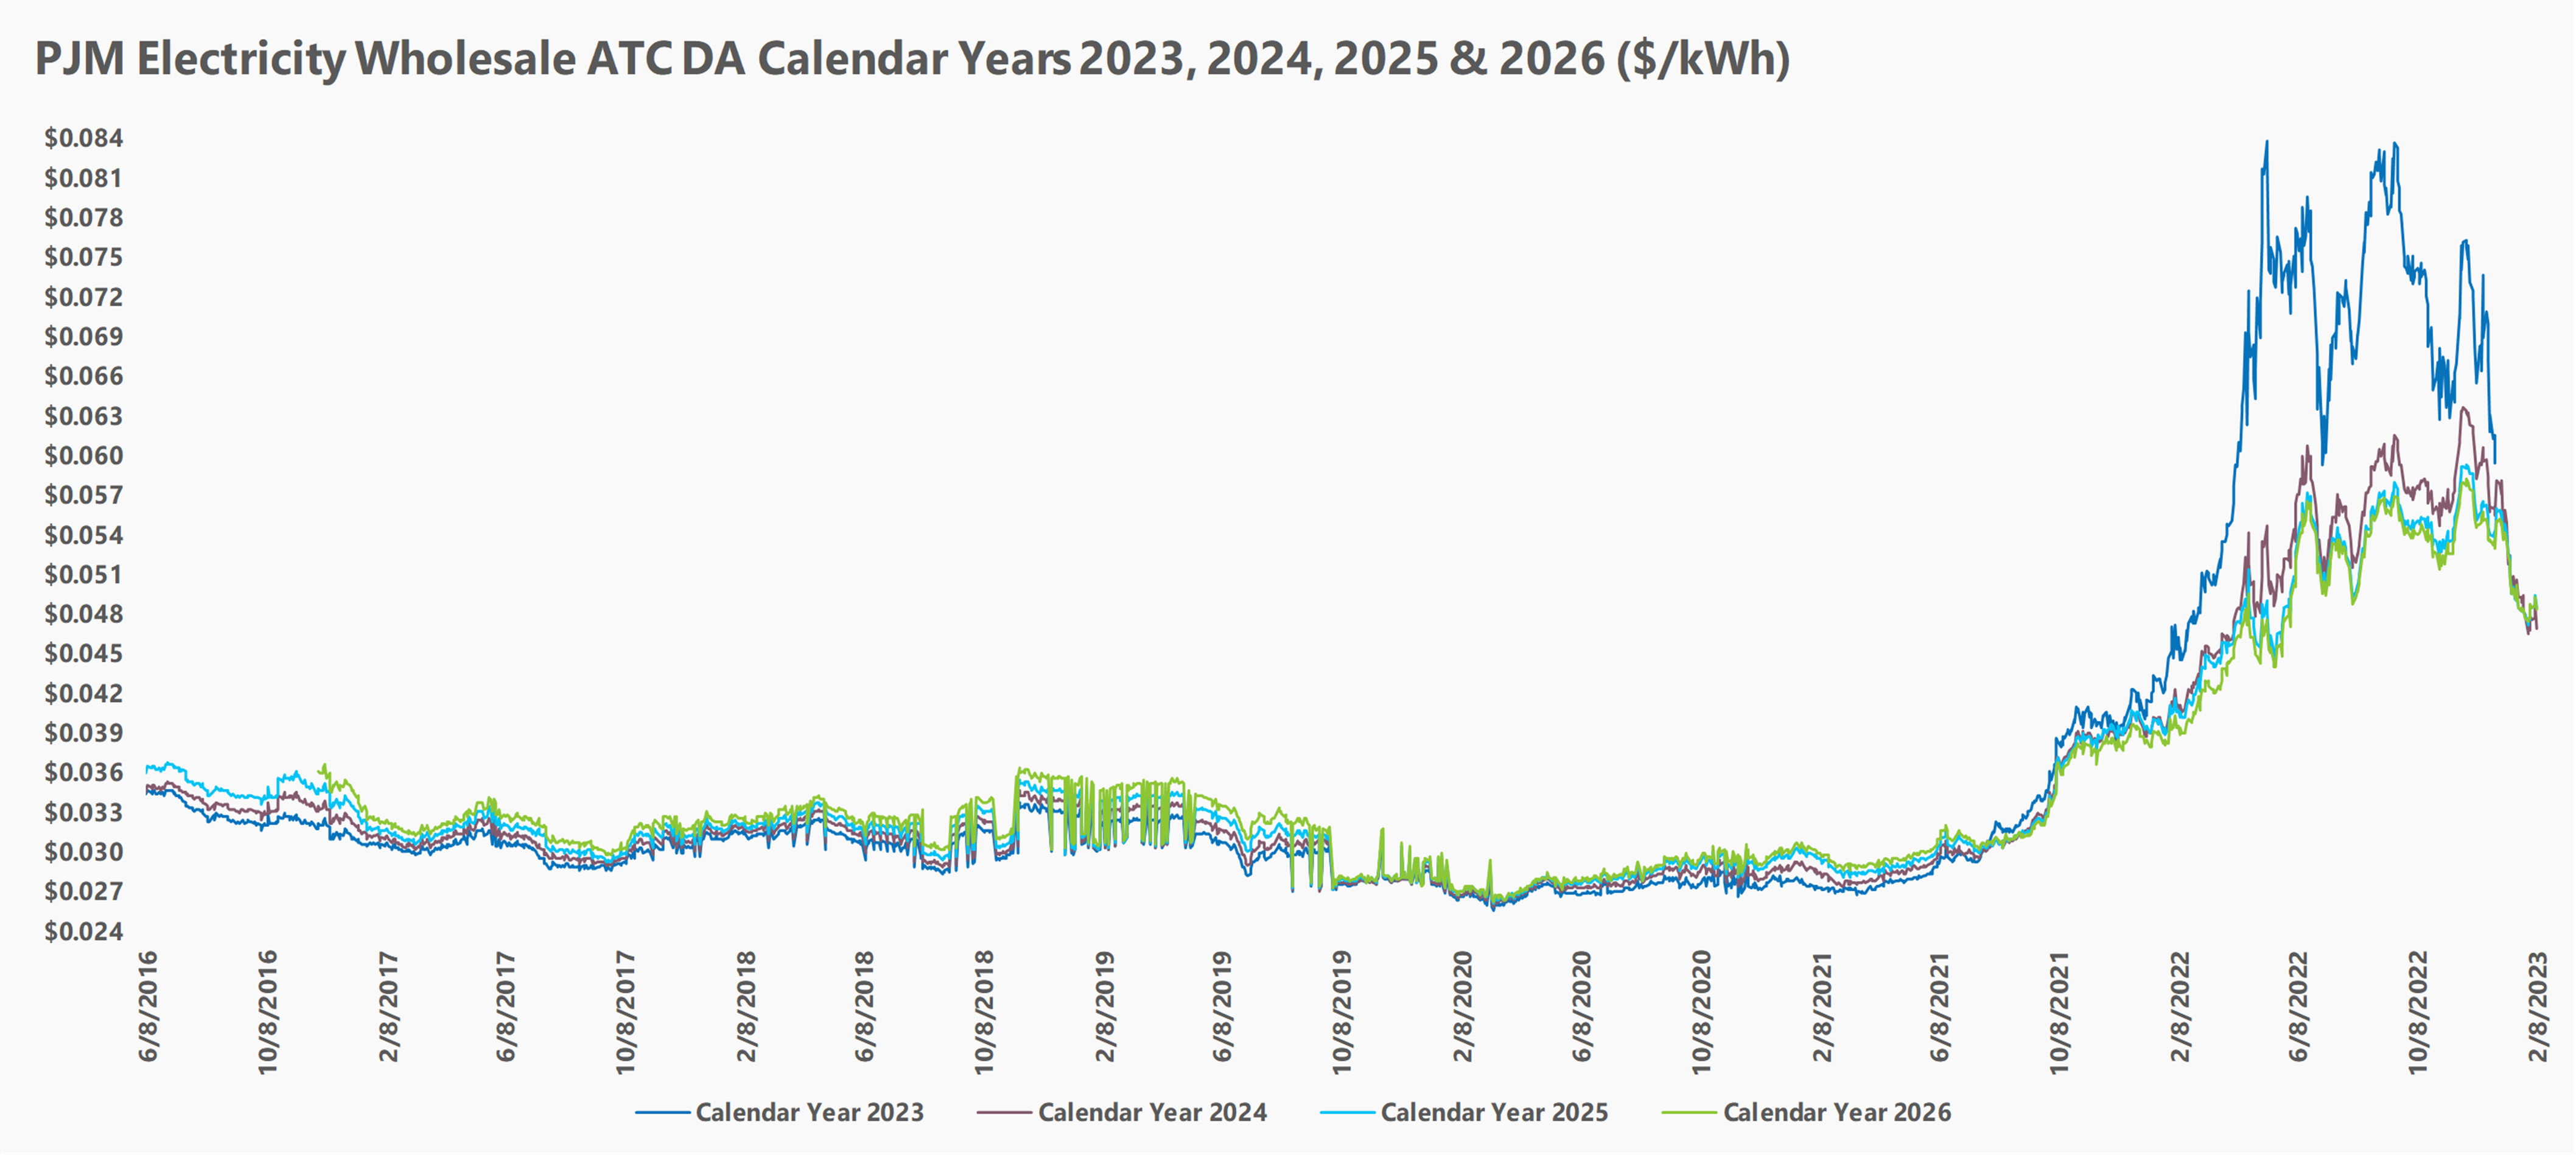
The graph above takes a look at PJM Western Hub ATC DA Wholesale Electricity Calendar Years 2022, 2023, 2024, and 2025 together.
Houston Ship Channel
Houston Ship Channel Wholesale Calendar Year 2024 future prices started near the 52-week low in February last year. From there, future prices began a long rally up until they established a high point in June. Following that, prices swung up and down, first with a significant drop into the start of July, followed by a larger rally up until the start of September that established the new 52-week high. Since establishing the new high, future prices have crashed down and they have recently established the 52-week low, which prices are still close to now. Currently HSC prices are down about 38.3% from September 1st’s 52-week high, which is below the average by around 22.6%.
Houston Ship Channel Wholesale Calendar Year 2023 Week to Week Fluctuation ($/Therm)

The graphs above show the price movement of Calendar Year 2023 Houston Ship Channel Wholesale Naural Gas over various periods of time. The price of the calendar year is shown on the left y-axis in relation to the date of the pricing on the bottom x-axis. On the 52-week and short-term graphs, you can see the minimum, maximum, and average prices of the past 52 weeks indicated by the gray lines.
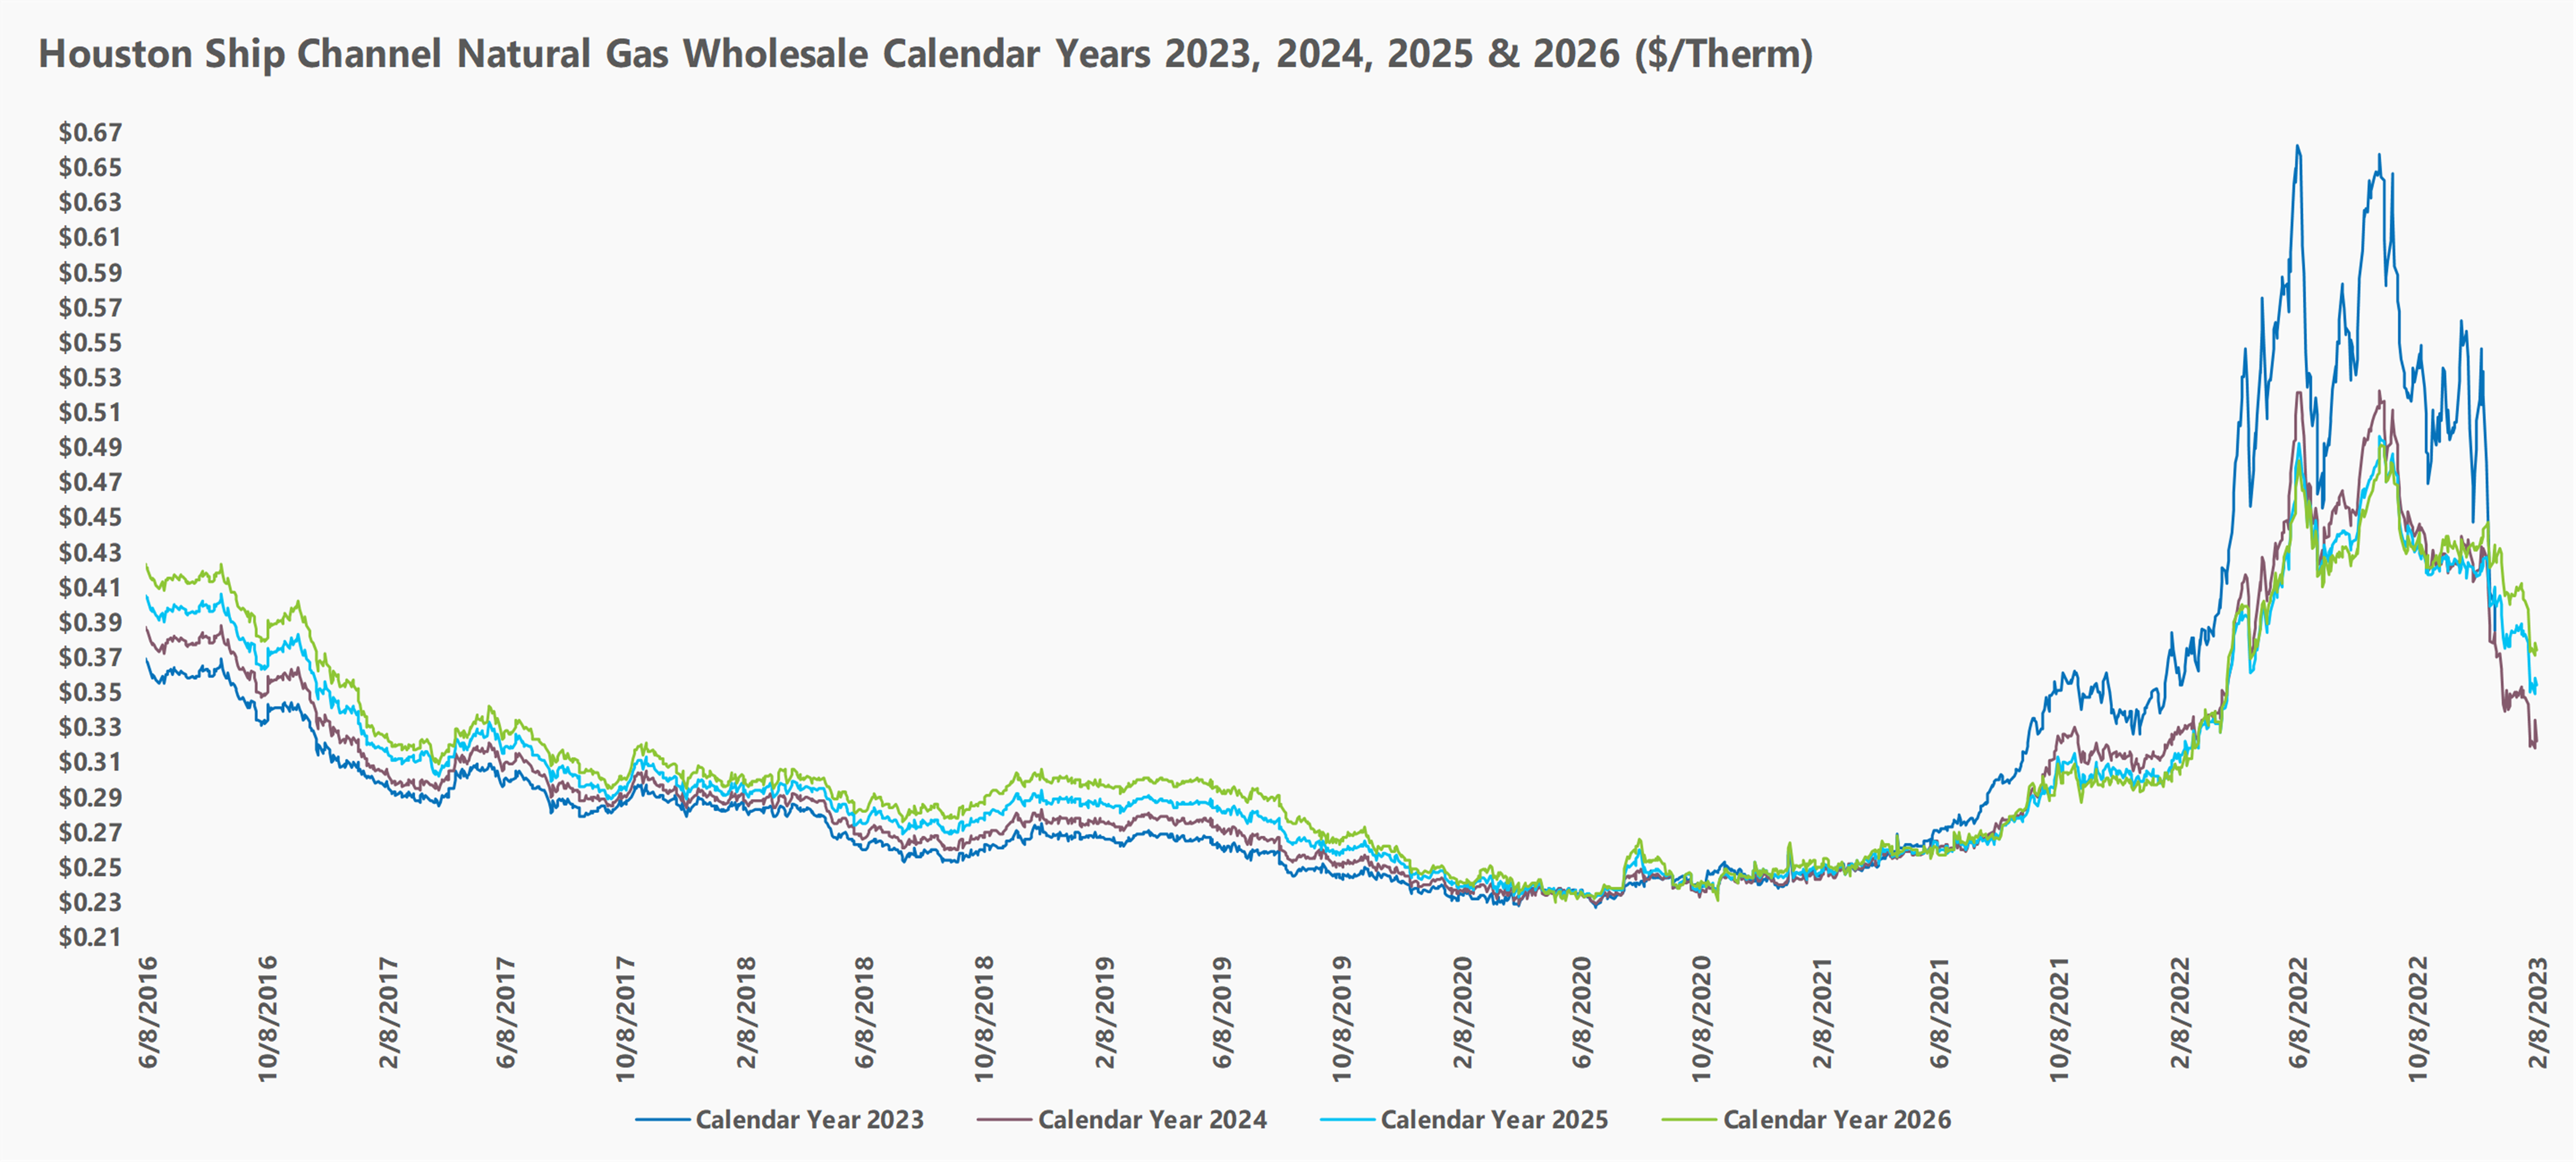
The graph above takes a look at Houston Ship Channel Natural Gas Wholesale Calendar Years 2022, 2023, 2024 and 2025 together.
ERCOT Houston
ERCOT Houston Load Zone Around-the-Clock Calendar Year 2024 future prices started at the 52-week low in February last year. From there, future prices began a long rally up that continued until they hit a high point in June. Following that, future prices swung up and down, first with a significant drop into July, followed by a larger rally up that established the new 52-week high at the start of September. Next future prices had a large drop to be close to the 52-week average in October where prices continued to range above the average until the start of January. Recently, future prices have continued to move down to be closer to the 52-week low. Currently Houston prices are down about 35.2% from September 5th’s 52-week high, which is below the average by around 18.9%.
ERCOT Houston Load Zone ATC RT Wholesale Calendar Year 2023 Week to Week Fluctuation ($/kWh)

The graphs above show the price movement of Calendar Year 2023 ERCOT Houston Load Zone ATC RT Wholesale Electricity over various periods of time. The price of the calendar year is shown on the left y-axis in relation to the date of the pricing on the bottom x-axis. On the 52-week and short-term graphs, you can see the minimum, maximum, and average prices of the past 52 weeks indicated by the gray lines.
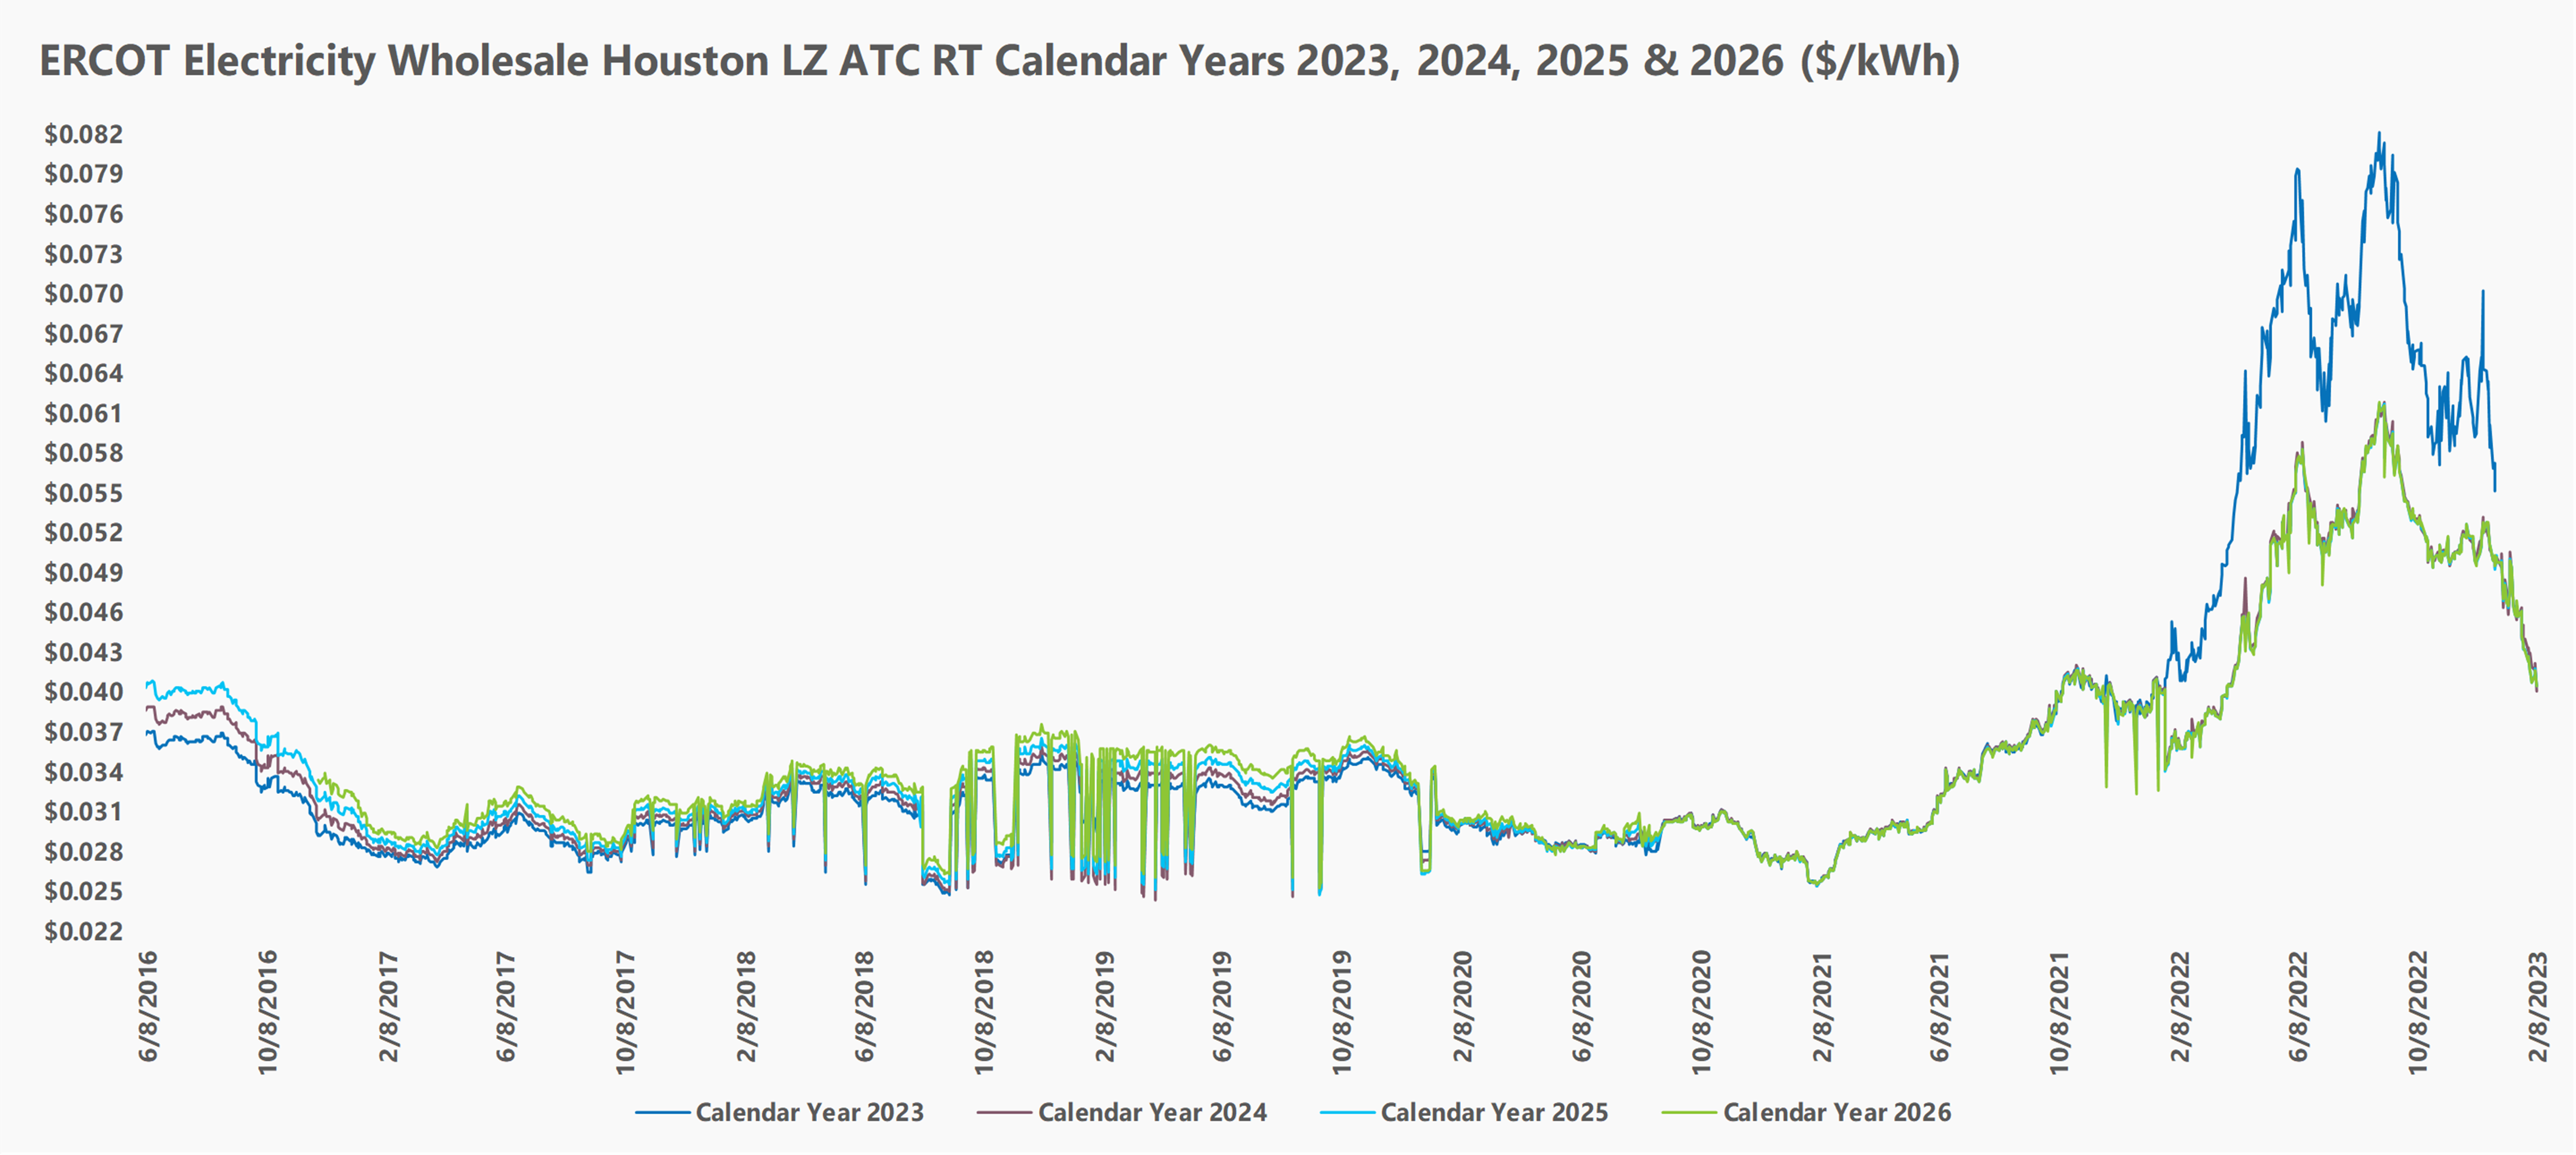
The graph above takes a look at PJM Western Hub ATC DA Wholesale Electricity Calendar Years 2022, 2023, 2024, and 2025 together.
General Disclaimer: This information is provided as a courtesy to our clients and/or potential clients and should not be construed as an offer to sell or as a solicitation of an offer to buy securities based on, or contracts in or for, any energy commodity. Mantis Innovation does not sell electricity and/or natural gas, and as such, the actual terms and conditions of competitive supply are solely provided for by the competitive supplier’s contract with the client. Reliance on this information for decisions is done so at the sole risk of the reader and past performance is not indicative of future results. This information is provided as a general description of various electricity and/or natural gas purchasing strategies that may be decided upon by our clients. Both clients and potential clients should consider their individual circumstances and other sources of available information before arriving at a decision. Graphs and charts are for illustrative purposes only.
 Market Update – September 25, 2023 - This market update includes a natural gas storage update, electric and natural gas price movement, and a weather outlook. By… Read more
- Market Update – June 12, 2023 - This market update includes a natural gas storage update, electric and natural gas price movement, and a weather outlook. By… Read more
- Market Update – April 24, 2023 - This market update includes a natural gas storage update, electric and natural gas price movement, and a weather outlook. By… Read more