This market update provides an overview of natural gas storage levels, Henry Hub spot price history, and historical LMP pricing across major electricity markets. Together, these indicators offer a clearer understanding of market fundamentals and short‑term price drivers. While this report is intended as a general overview of current conditions, the Mantis Innovation energy solutions team is available for deeper analysis and tailored pricing strategies to support your organization’s needs. For more detailed insights, you can subscribe to our weekly market update emails delivered directly to your inbox.
 Natural Gas
Storage Report
The amount of natural gas available for usage is very important in the energy industry because, among other things, it is used for heating, and as a main fuel source for generating electricity at power plants to be consumed by both homes and businesses. By comparing current levels of natural gas storage to the levels of last year and the past five years, an assessment as to the state of natural gas supplies to meet demand can be made.
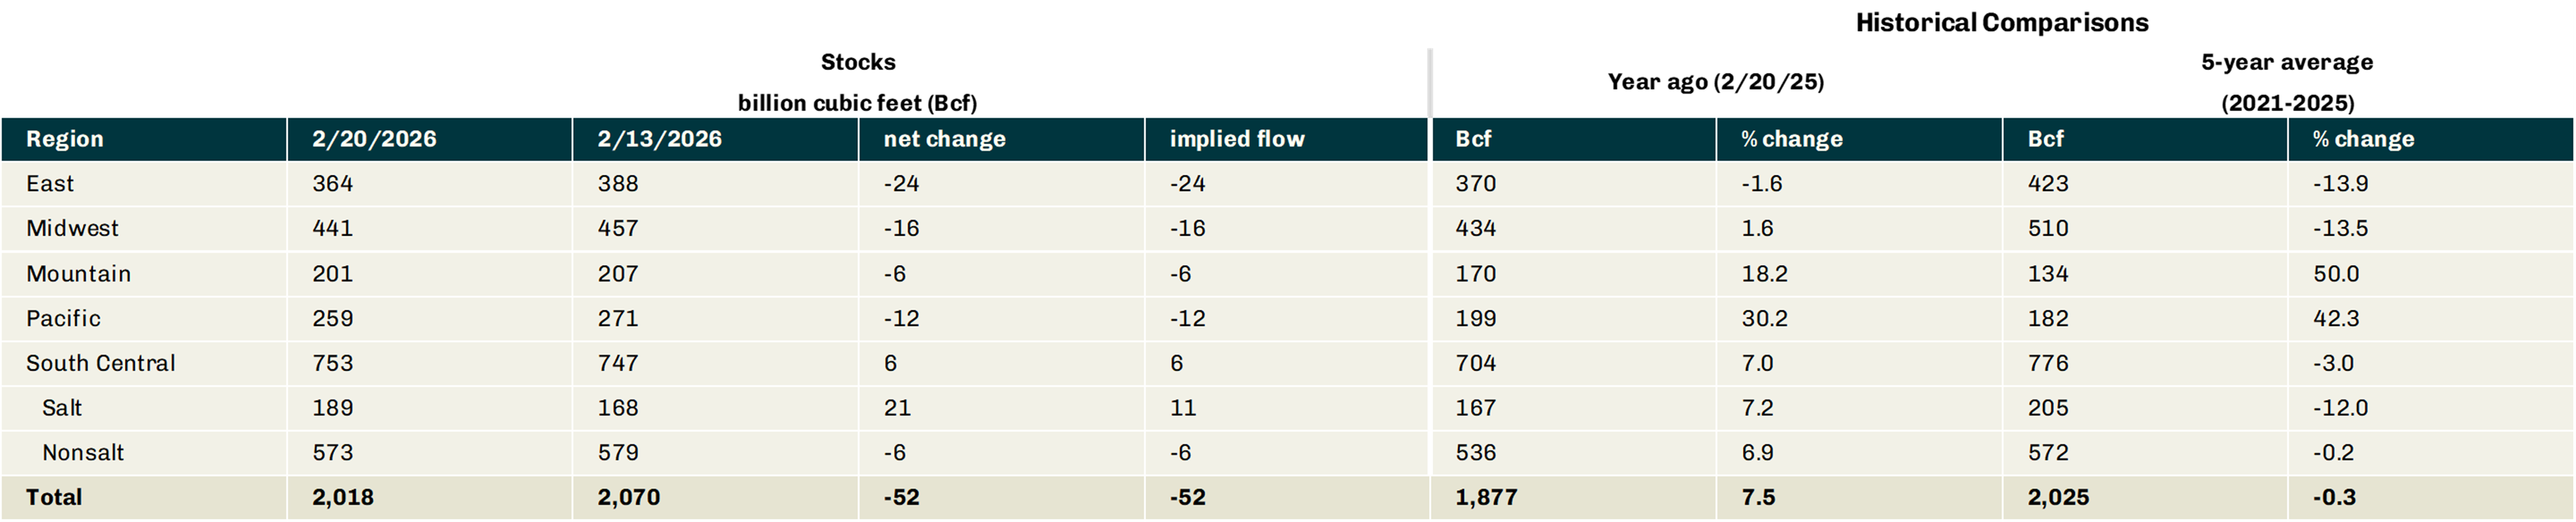
The total net withdrawal for the week ending 2/20/26 was 52 Bcf.
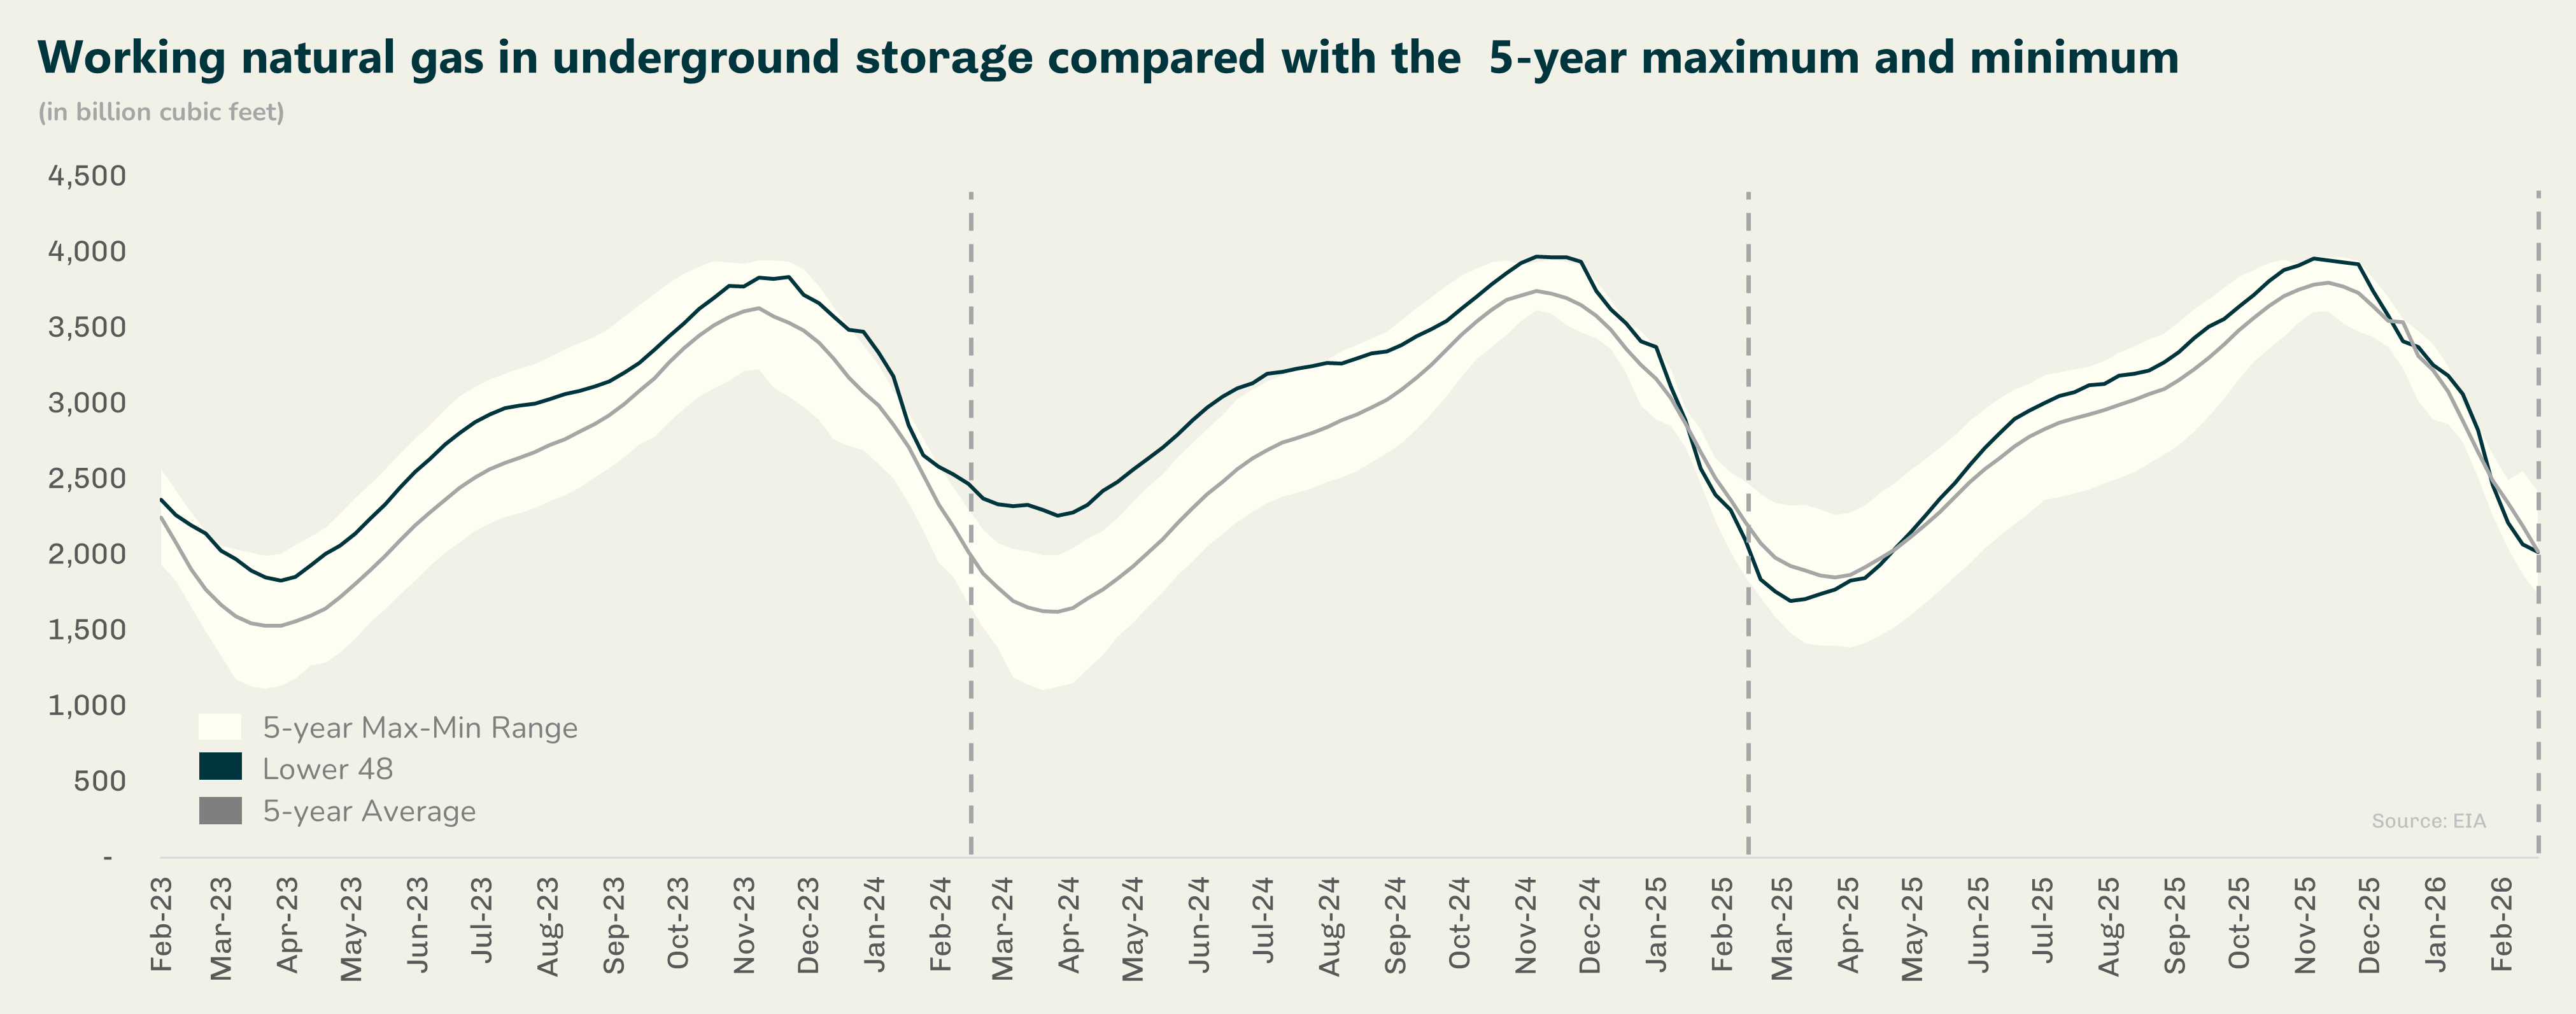
Storage is now 141 Bcf above last year, and 177 Bcf above the 5-year average, which is now above the 5-year historical range.
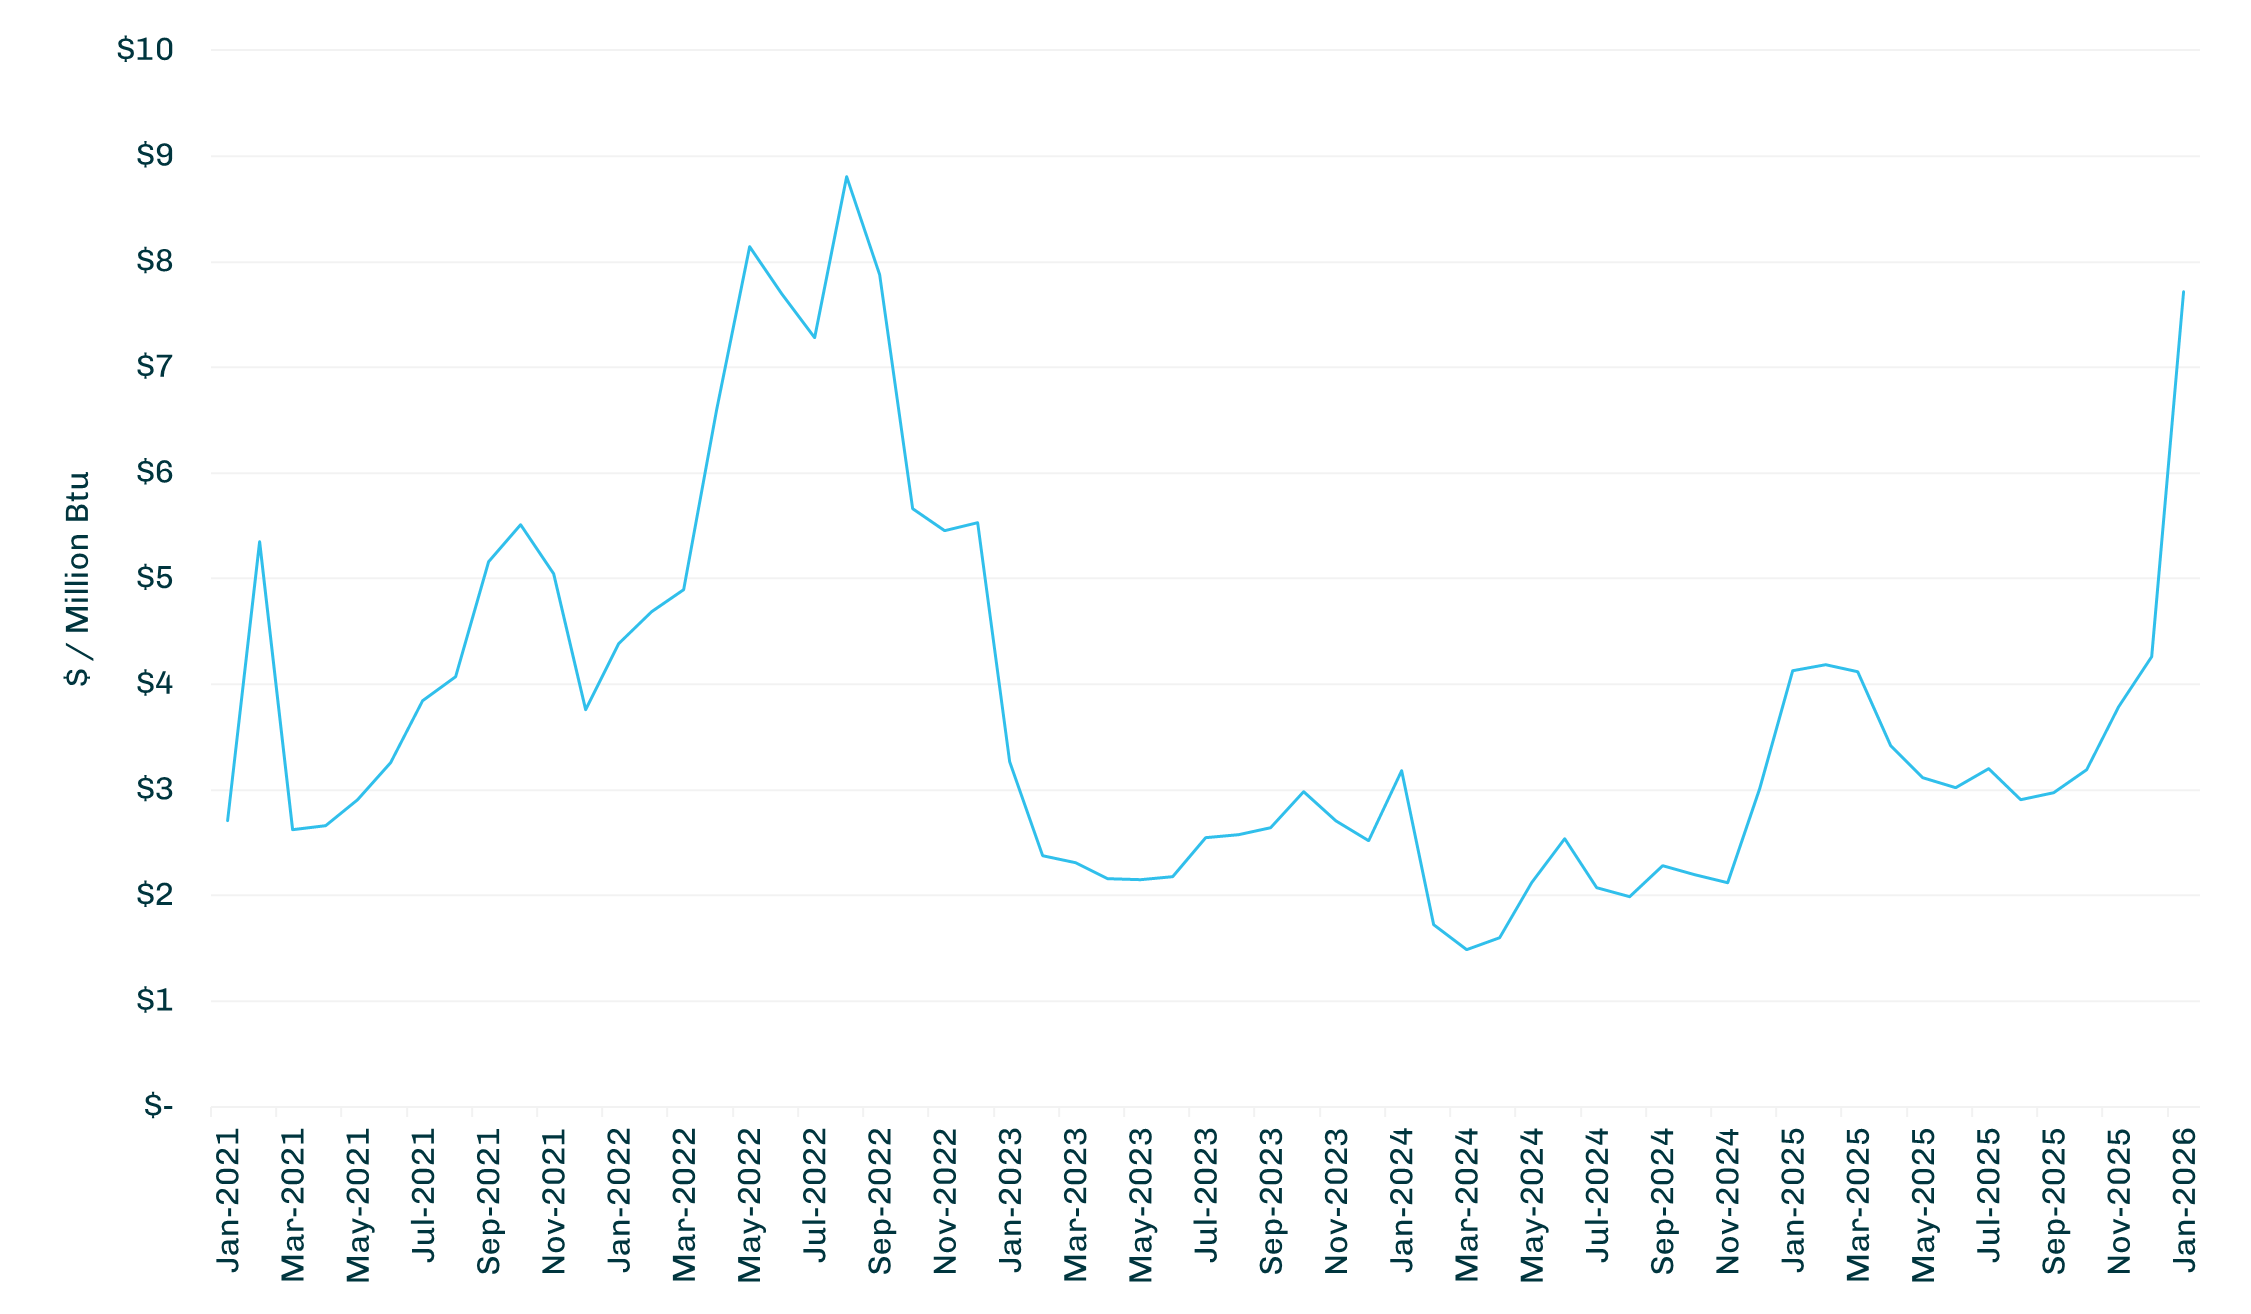
Henry Hub Natural Gas Monthly Spot Pricing - 2021-2026 ($/Million Btu)
 Electricity
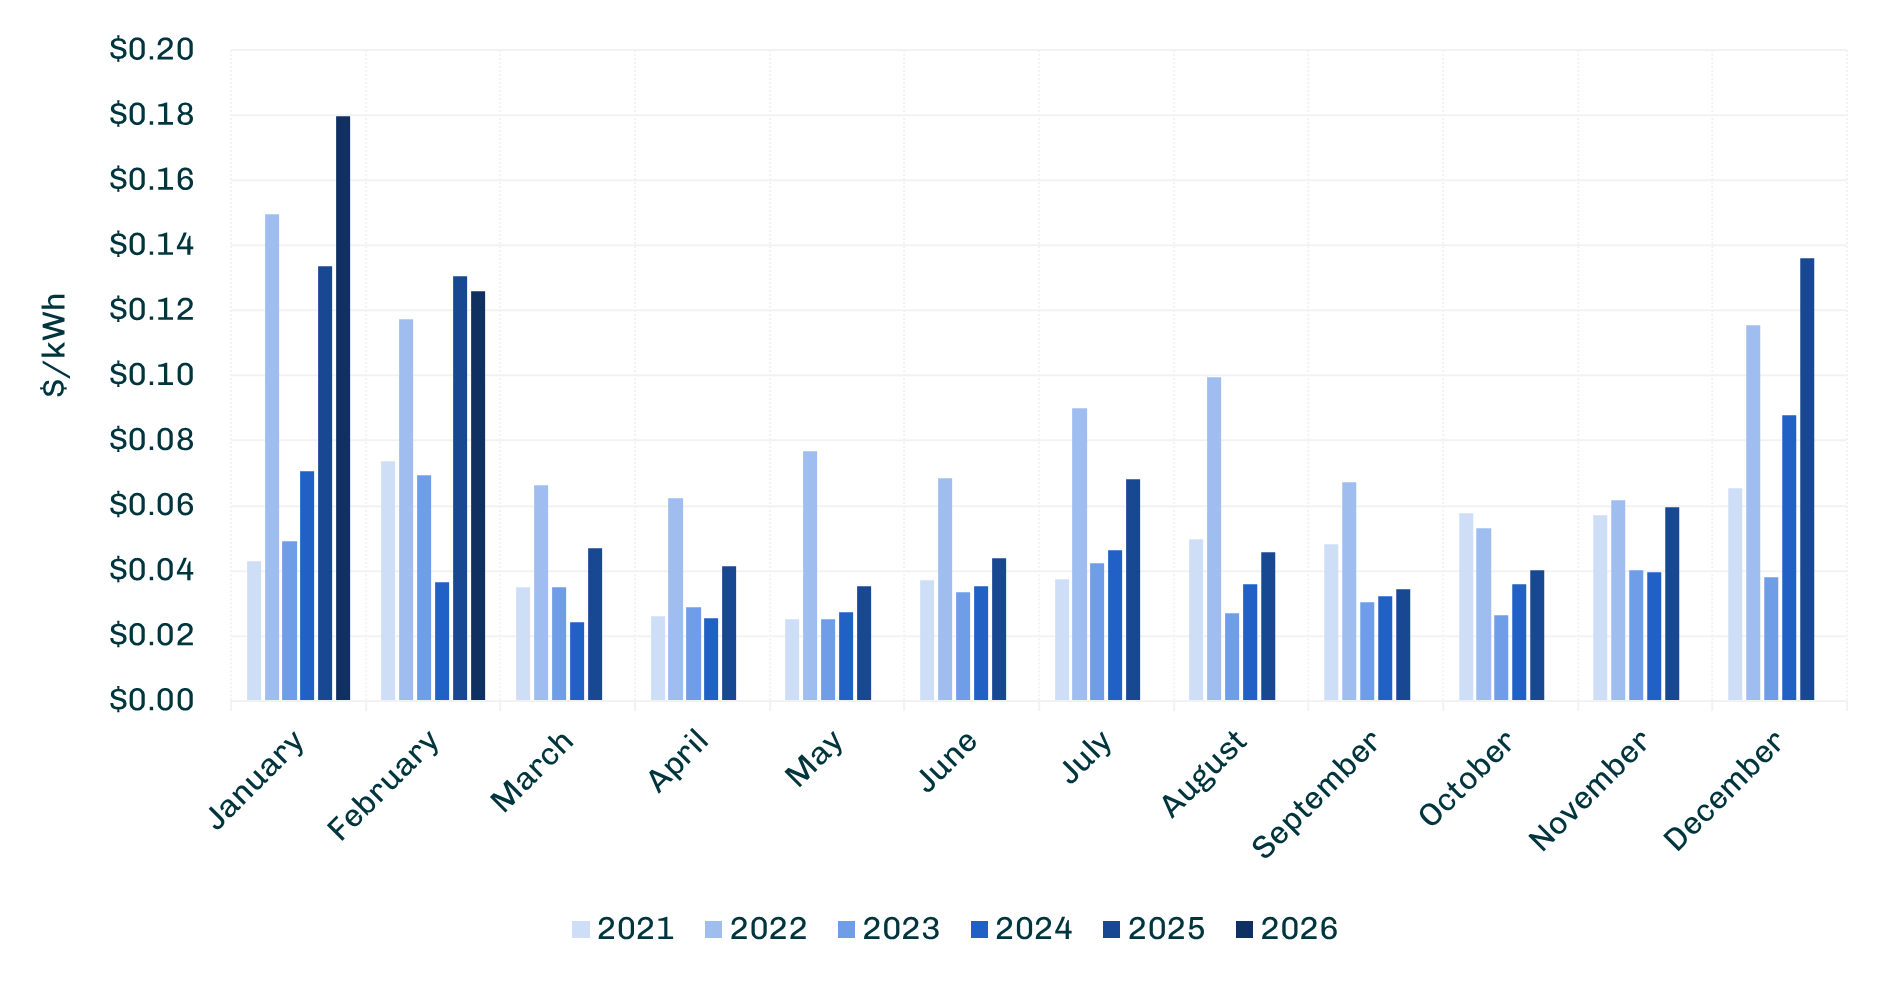
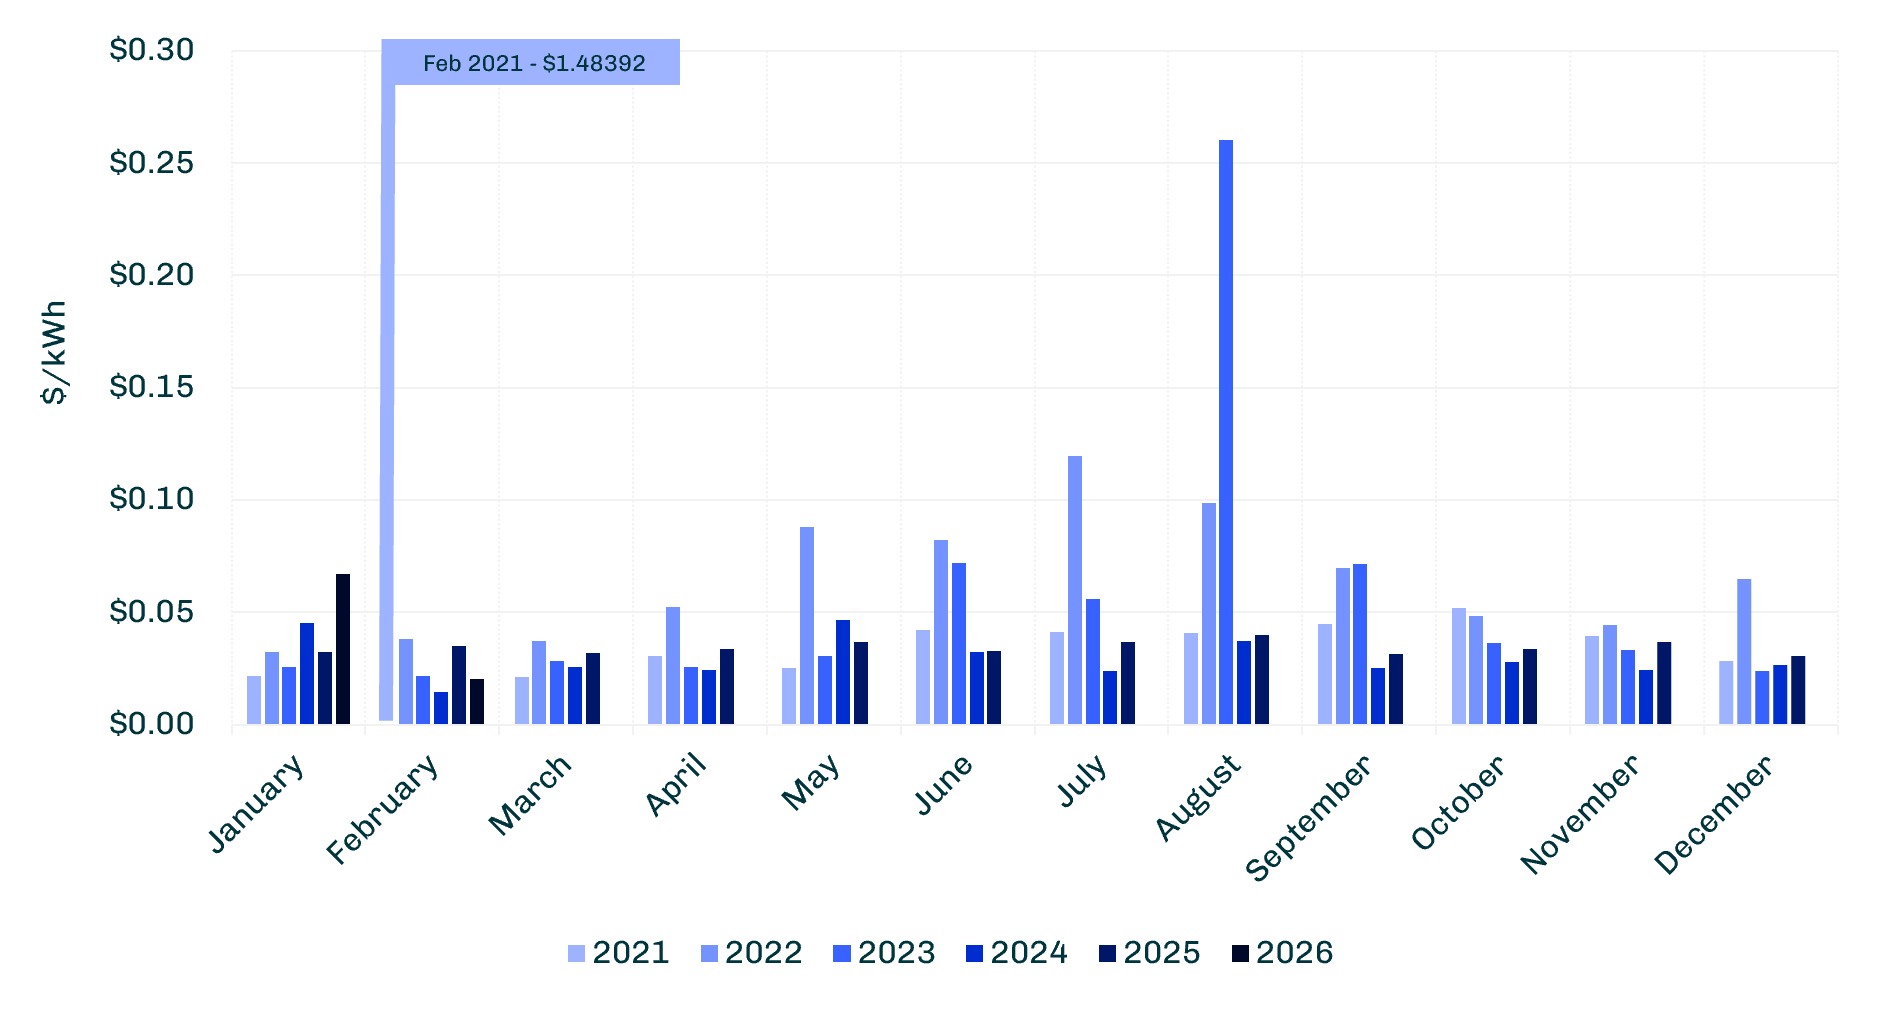
ISO-NE Internal Hub Day-Ahead Historical Monthly Wholesale LMP ($/kWh)
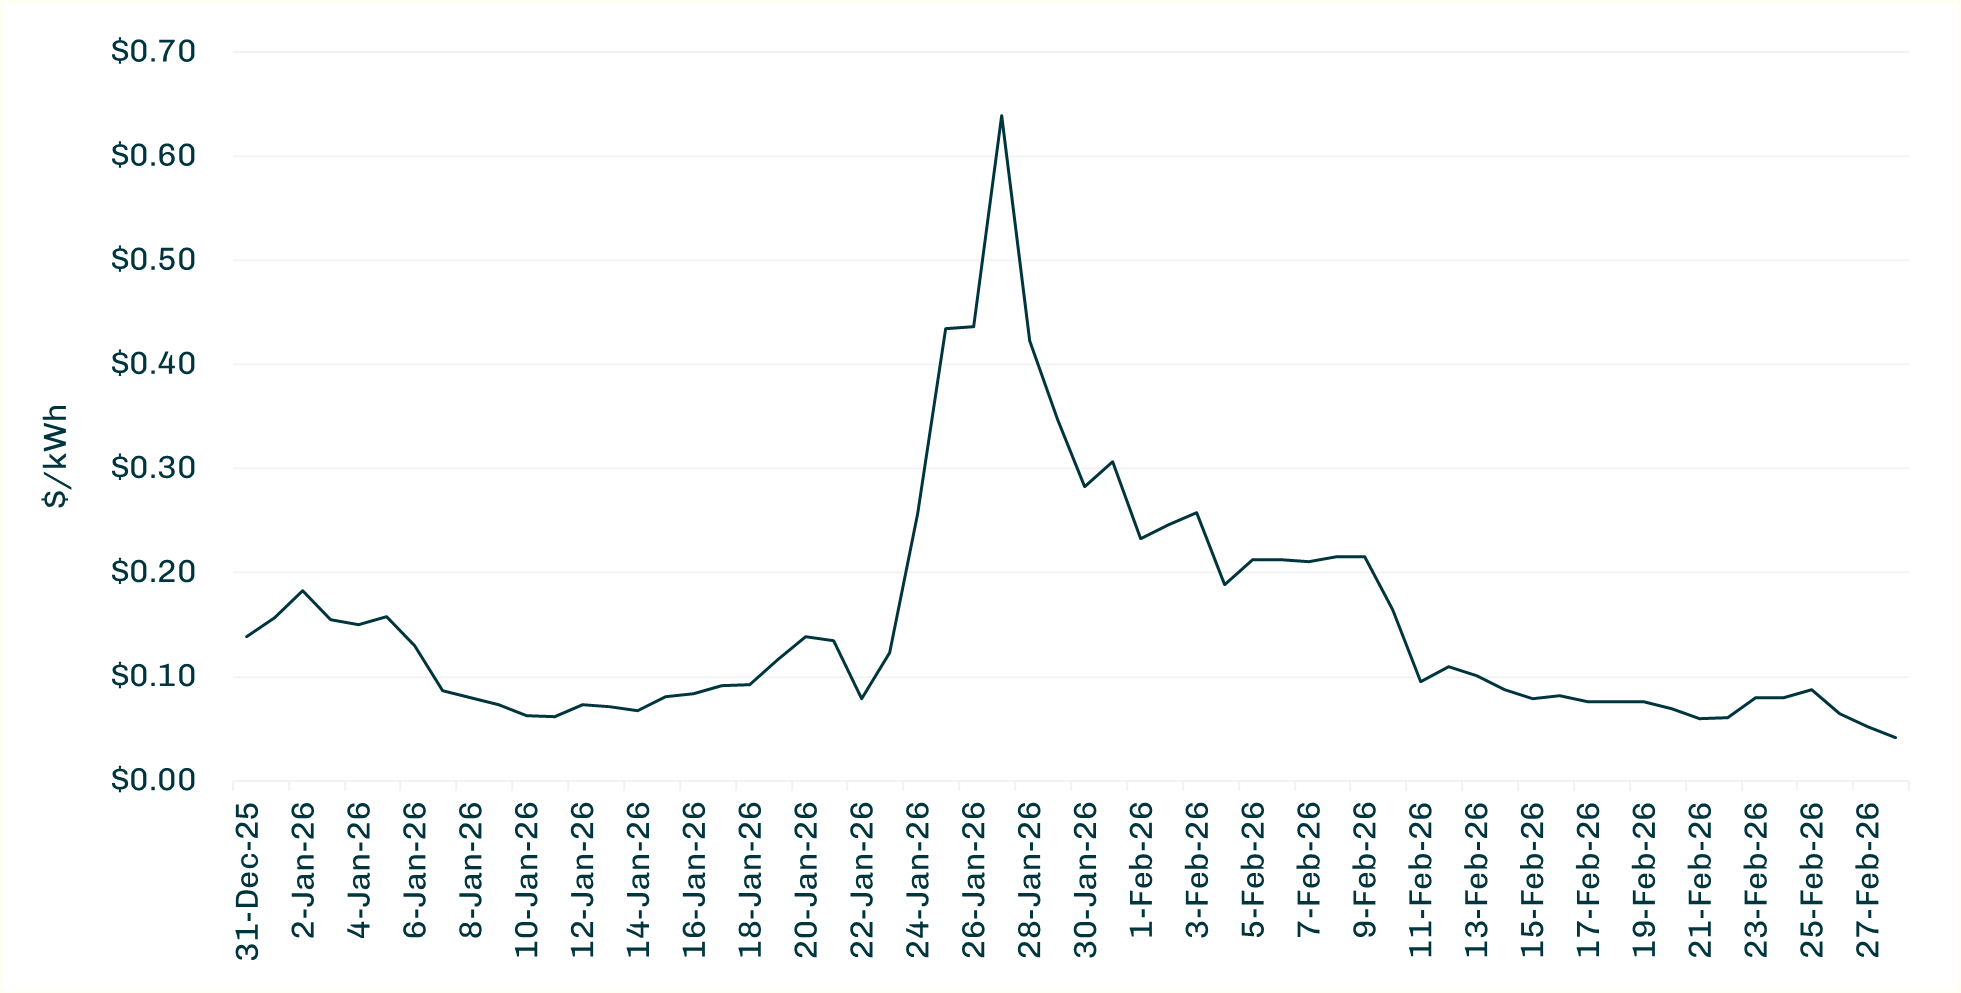
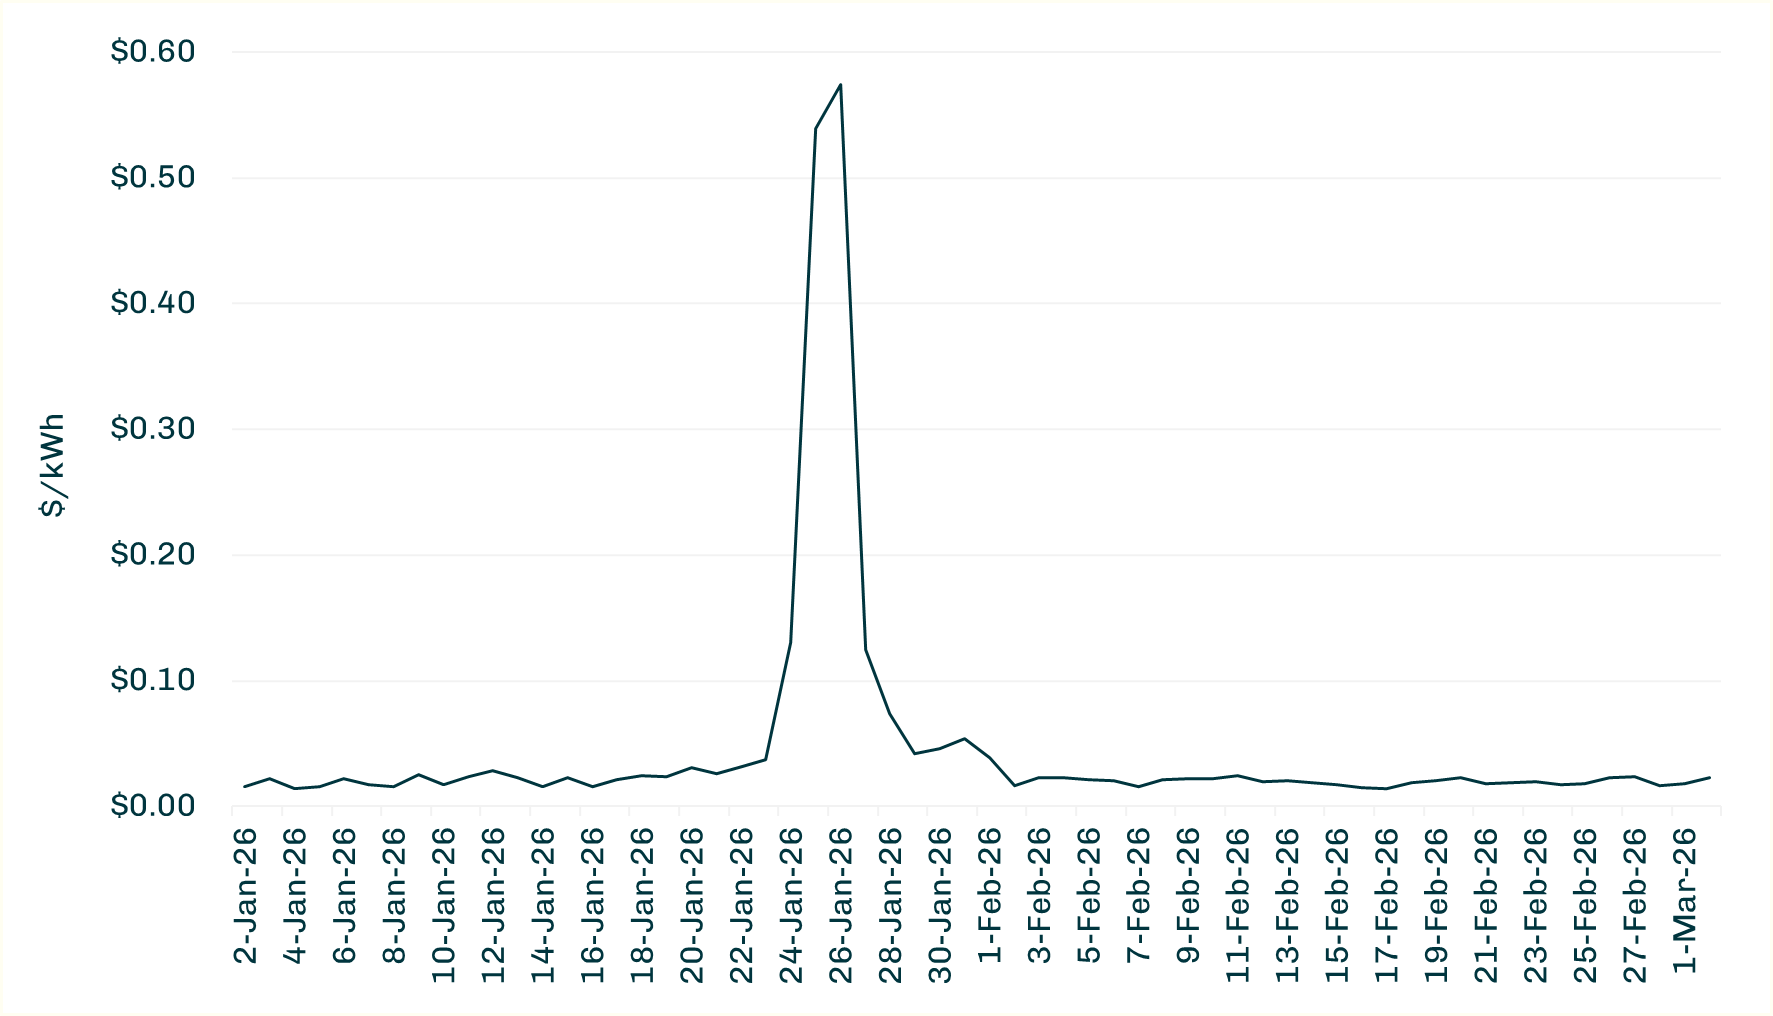
ISO-NE Internal Hub Daily Day-Ahead Wholesale LMP ($/kWh)
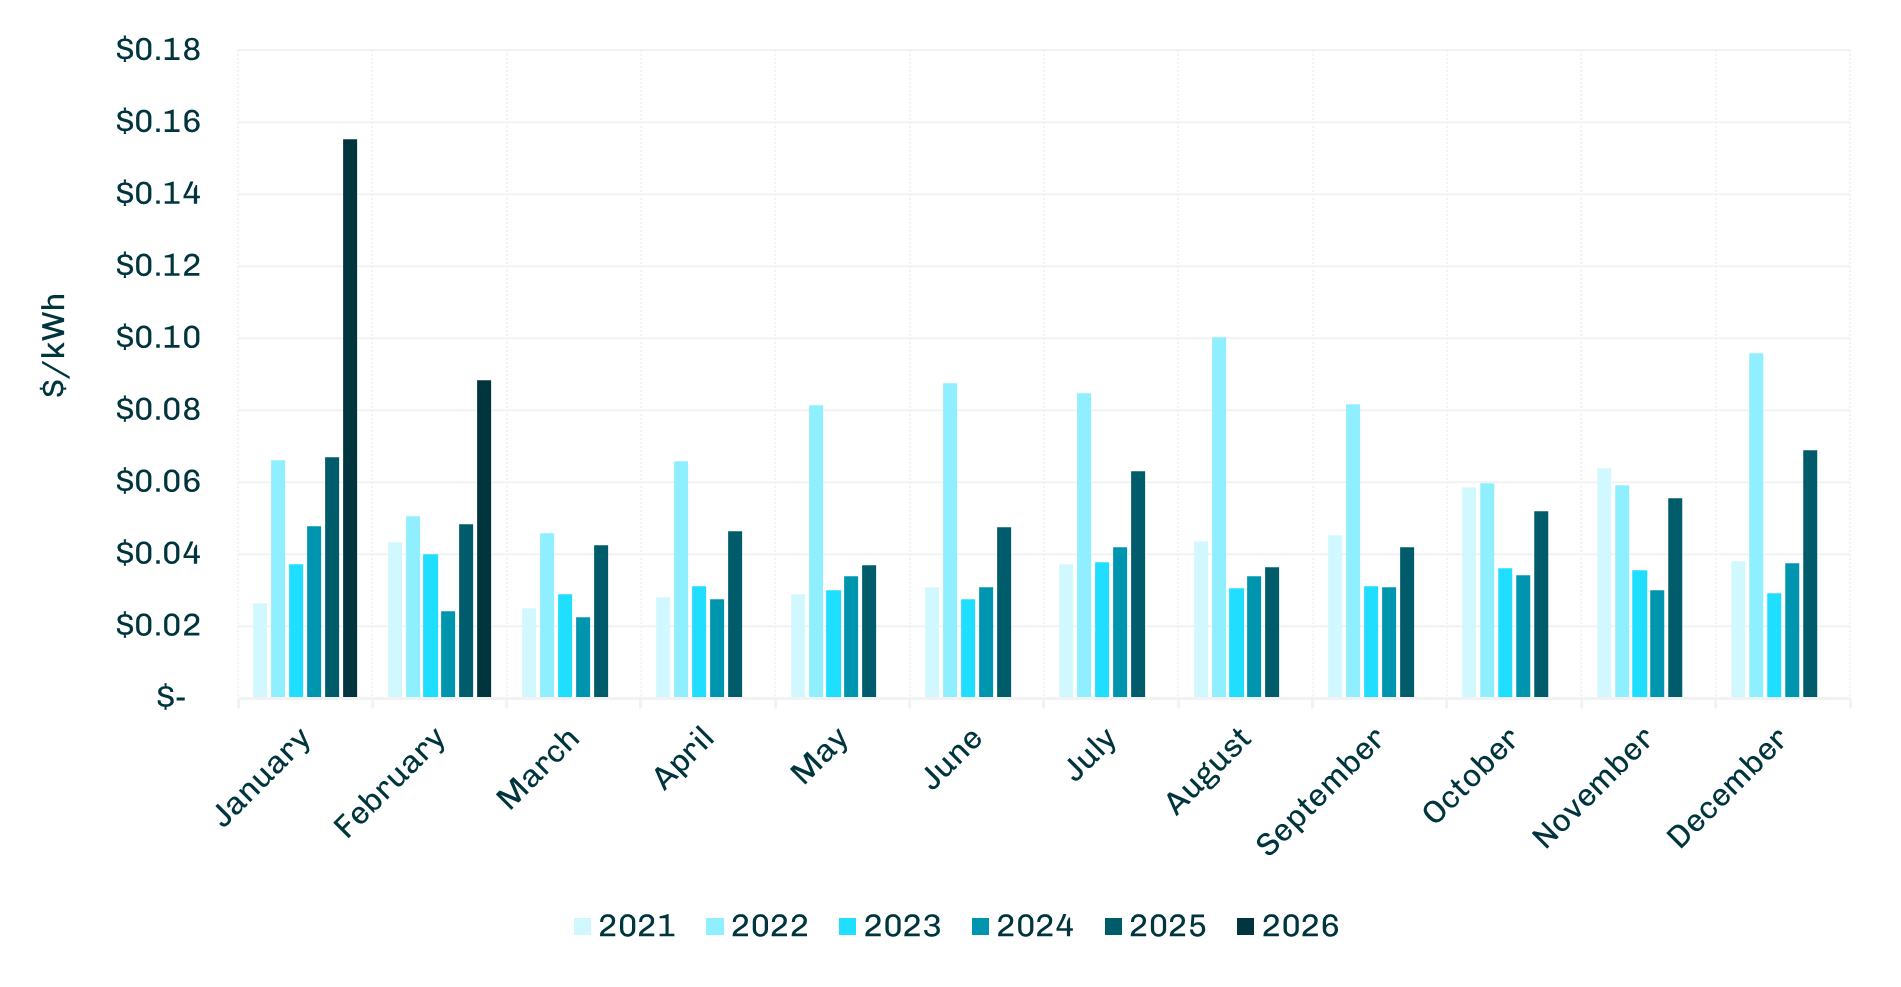
PJM Western Hub Day-Ahead Historical Monthly Wholesale LMP ($/kWh)
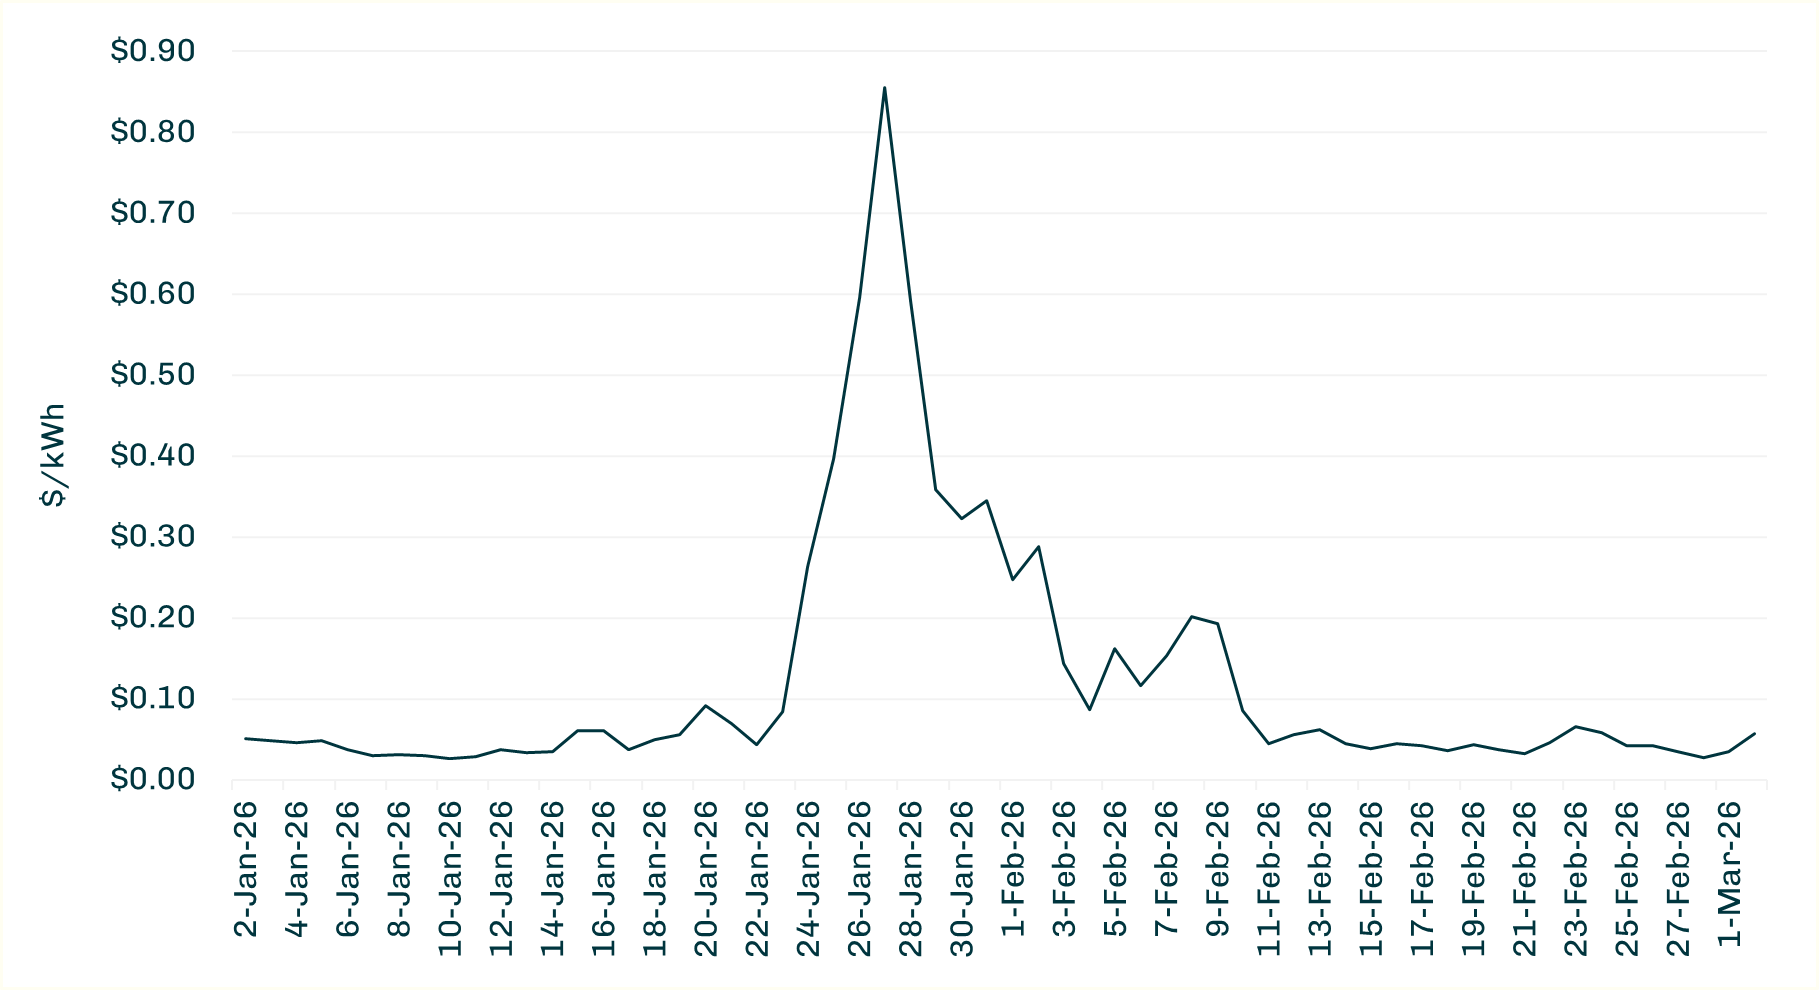
PJM Western Hub Daily Day-Ahead Wholesale LMP ($/kWh)
ERCOT Houston Hub Day-Ahead Historical Monthly Wholesale LMP ($/kWh)
ERCOT Houston Hub Daily Day-Ahead Wholesale LMP ($/kWh)
Graph Descriptions:
Natural Gas: Henry Hub Wholesale Historical Spot Pricing - 2021-2026 ($/Million Btu)
This graph shows the historical Henry Hub natural gas spot price plotted as a continuous time series. The price is shown on the y‑axis in dollars per million Btu, with the x‑axis showing monthly spot pricing from 2021 through the current month of 2026. The line chart provides a long‑term view of spot market movement, showing price variations across the six‑year period.
Electricity: Day-Ahead Historical Monthly Wholesale LMP ($/kWh)
These graphs for each RTO display a multi‑year comparison of average monthly locational marginal prices (LMPs) for calendar years 2021 through 2026. Each month is represented along the x‑axis, with price shown on the y‑axis in dollars per kilowatt-hour. Color‑coded bars indicate the monthly average for each year, allowing a clear year‑to‑year comparison of monthly pricing across the six-year period.
Electricity: Daily Day-Ahead Wholesale LMP ($/kWh)
These graphs for each RTO show daily day-ahead locational marginal prices (LMPs) for the previous 60 days. The price is plotted on the y‑axis in dollars per kilowatt-hour, with each day of the month displayed along the x‑axis. Individual daily values are connected to illustrate price movement throughout the period, providing a short-term view of day‑ahead market variability.
General Disclaimer: This information is provided as a courtesy to our clients and/or potential clients and should not be construed as an offer to sell or as a solicitation of an offer to buy securities based on, or contracts in or for, any energy commodity. Mantis Innovation does not sell electricity and/or natural gas, and as such, the actual terms and conditions of competitive supply are solely provided for by the competitive supplier’s contract with the client. Reliance on this information for decisions is done so at the sole risk of the reader, and past performance is not indicative of future results. This information is provided as a general description of various electricity and/or natural gas purchasing strategies that may be decided upon by our clients. Both clients and potential clients should consider their individual circumstances and other sources of available information before arriving at a decision. Graphs and charts are for illustrative purposes only.